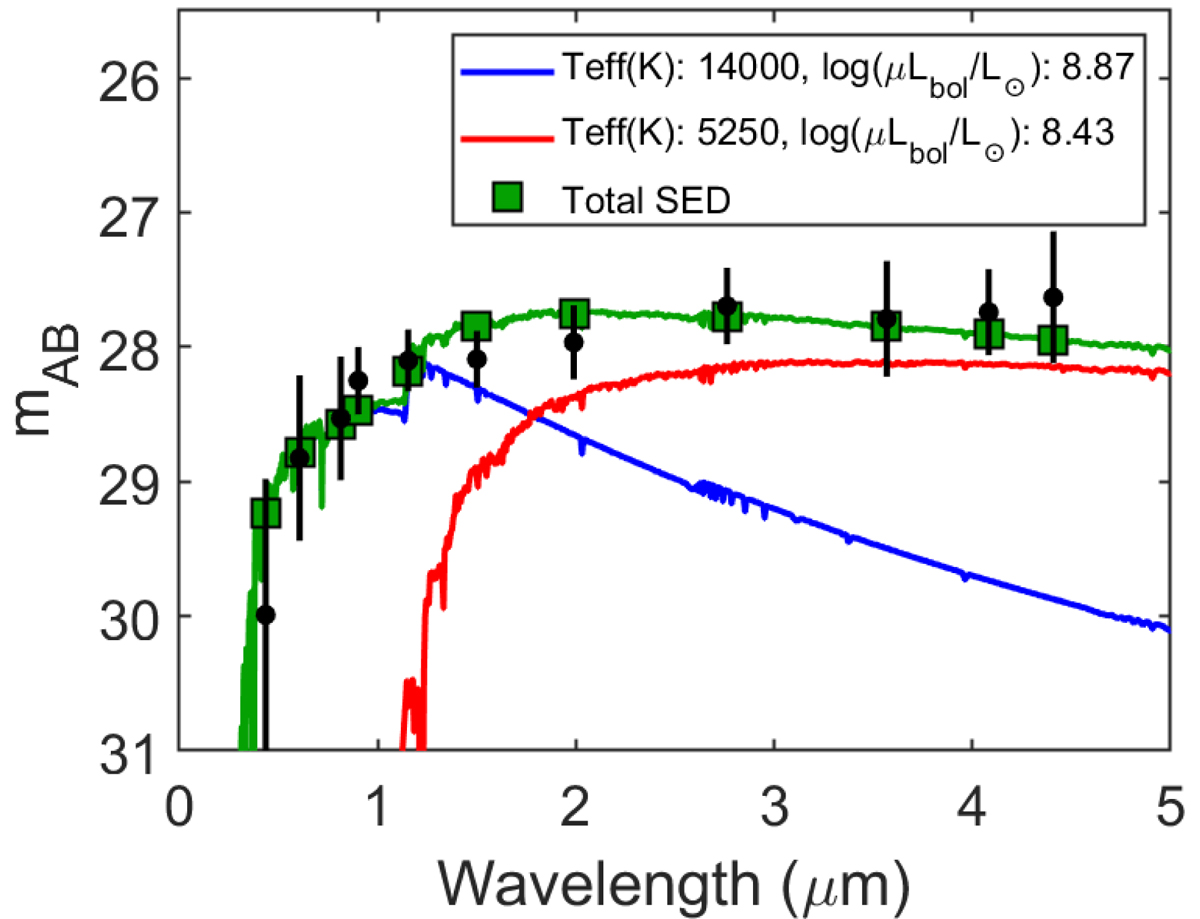
Fig. 3.
Download original image
Mothra’s SED and the best matching binary model. The blue and red lines represent model stellar spectra for stars with Teff and μLbol as shown in the legend. Models are from the Lejeune et al. (1997) compilation of stellar atmosphere spectra at solar metallicity redshifted to z = 2.091. The green line shows the combined SED. Black circles with error bars represent the observed photometric data and green boxes the model photometry resulting from the best-fit compound spectrum. If the two stars experience the same magnification, the high–Teff star has a bolometric luminosity ≈0.4 dex (a factor of ≈2.5) higher than that of the low–Teff star.
Current usage metrics show cumulative count of Article Views (full-text article views including HTML views, PDF and ePub downloads, according to the available data) and Abstracts Views on Vision4Press platform.
Data correspond to usage on the plateform after 2015. The current usage metrics is available 48-96 hours after online publication and is updated daily on week days.
Initial download of the metrics may take a while.