Fig. D.1.
Download original image
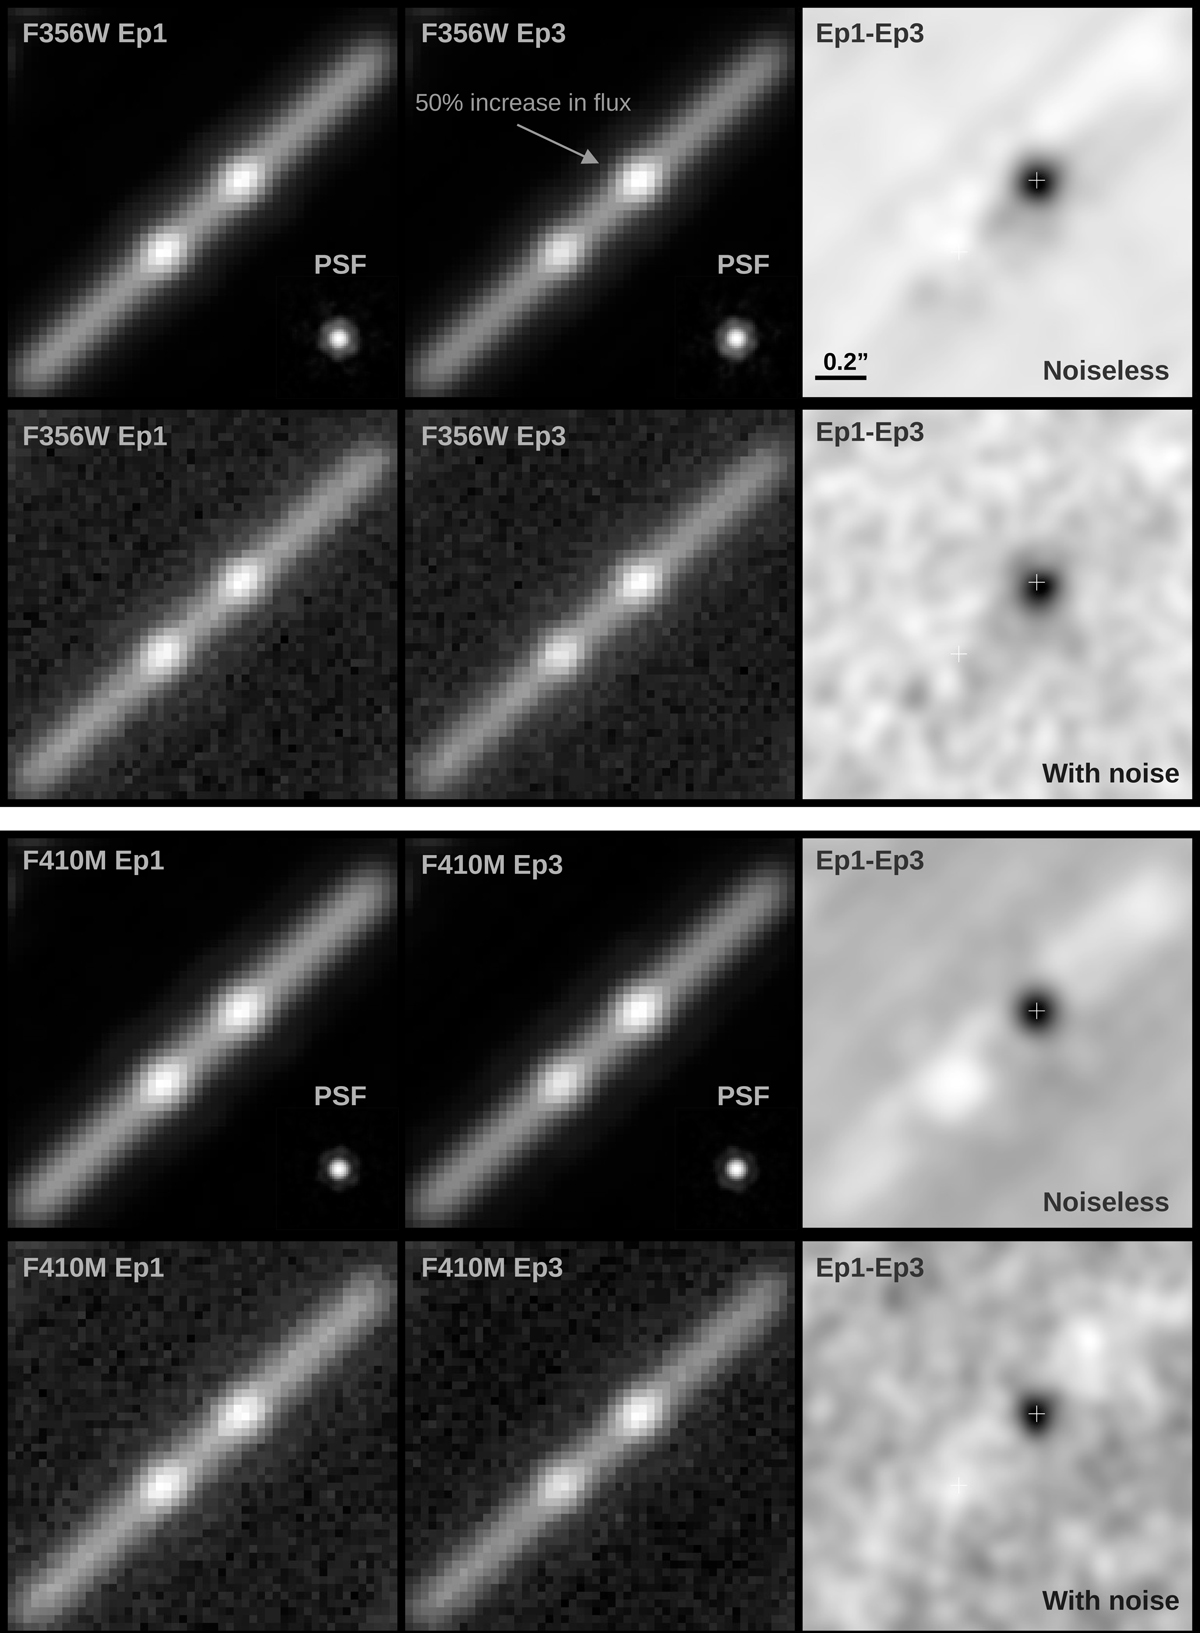
Illustrations of the VSVPA effect with mock data. The top two panels show the mock data F356W, and the bottom two panels show F410M. The first row of each pair shows noise-free data, and the second row shows results with noise added. From left to right, panels show simulated epoch 1, simulated epoch 3, and the difference image. The difference image is smoothed with a 0![]() 09 Gaussian as for the real data. All images are 1
09 Gaussian as for the real data. All images are 1![]() 5 across. The white cross marks the position of the varying point source. The arms of the cross are 0
5 across. The white cross marks the position of the varying point source. The arms of the cross are 0![]() 06 end-to-end.
06 end-to-end.
Current usage metrics show cumulative count of Article Views (full-text article views including HTML views, PDF and ePub downloads, according to the available data) and Abstracts Views on Vision4Press platform.
Data correspond to usage on the plateform after 2015. The current usage metrics is available 48-96 hours after online publication and is updated daily on week days.
Initial download of the metrics may take a while.