Fig. C.1.
Download original image
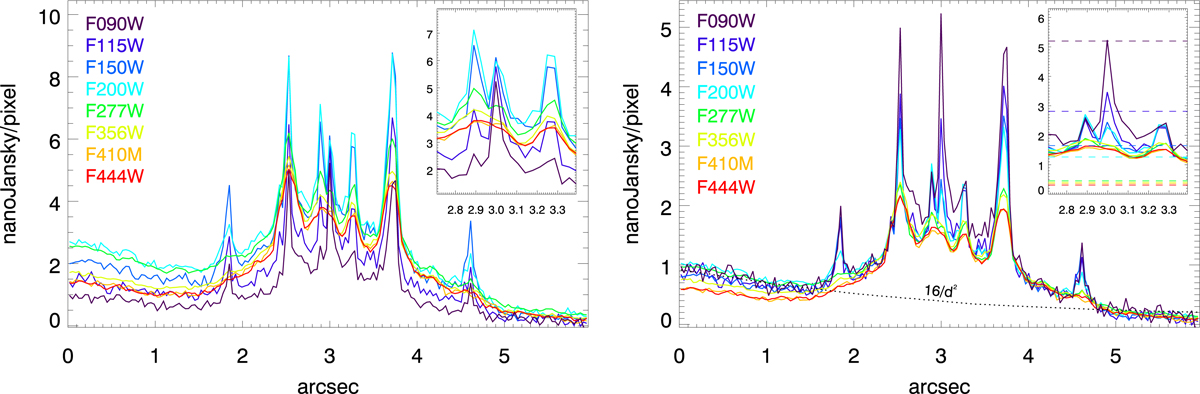
One-dimensional profiles along the Mothra arc. The left panel shows the observed surface-brightness profiles along the arc. Image a′ is on the left, Mothra is the peak in the middle at 3″, and a is on the right. The inset zooms in around the position of Mothra. The right panel shows the profiles rescaled by a multiplicative factor to match the amplitude of the F090W profile at ≈4![]() 2. The black dotted line shows a power-law model that traces the ICL with d being the distance to the BCG in arcseconds. For reference, Mothra is 6
2. The black dotted line shows a power-law model that traces the ICL with d being the distance to the BCG in arcseconds. For reference, Mothra is 6![]() 3 from the BCG. The horizontal dashed lines in the inset plot show the combined effect of the PSF dilution and rescaling. A source with the same flux in all bands as in F090W that is convolved by the PSF of each band would have its amplitude at the corresponding dashed lines.
3 from the BCG. The horizontal dashed lines in the inset plot show the combined effect of the PSF dilution and rescaling. A source with the same flux in all bands as in F090W that is convolved by the PSF of each band would have its amplitude at the corresponding dashed lines.
Current usage metrics show cumulative count of Article Views (full-text article views including HTML views, PDF and ePub downloads, according to the available data) and Abstracts Views on Vision4Press platform.
Data correspond to usage on the plateform after 2015. The current usage metrics is available 48-96 hours after online publication and is updated daily on week days.
Initial download of the metrics may take a while.