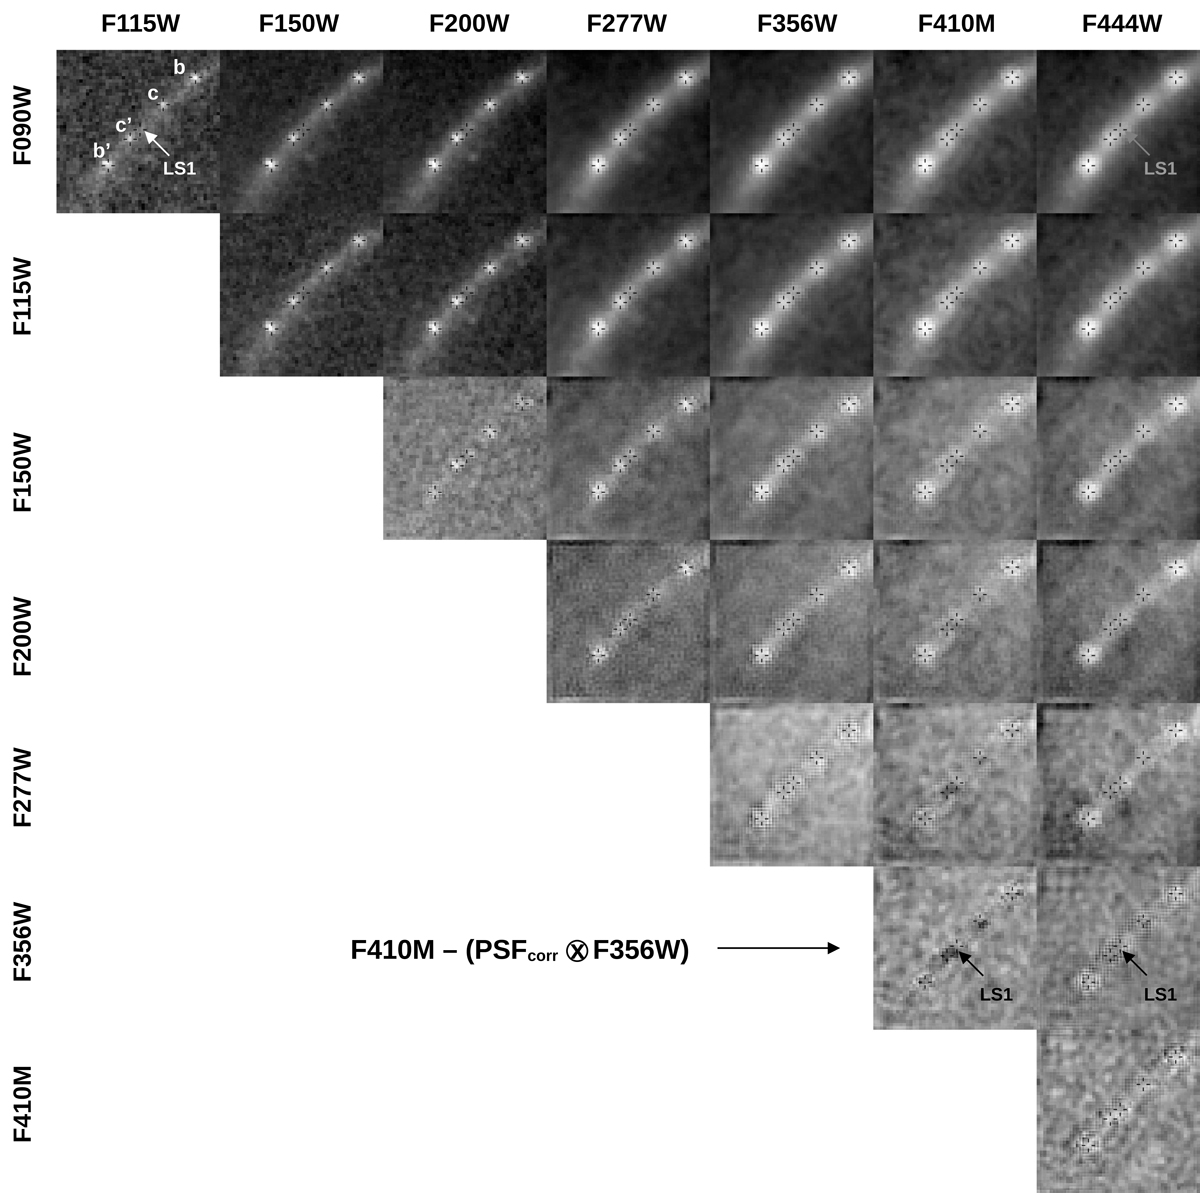
Fig. B.1.
Download original image
Simple image subtraction M1 with all NIRCam combinations. The positive image is shown by labels above each column, and the negative image is shown by labels to the left of each row. For example, the top-left panel shows F115W–F090W. Sources are labeled in the top-left panel with an arrow showing the location of LS1. Crosses in all panels show the source positions.
Current usage metrics show cumulative count of Article Views (full-text article views including HTML views, PDF and ePub downloads, according to the available data) and Abstracts Views on Vision4Press platform.
Data correspond to usage on the plateform after 2015. The current usage metrics is available 48-96 hours after online publication and is updated daily on week days.
Initial download of the metrics may take a while.