Fig. A.2.
Download original image
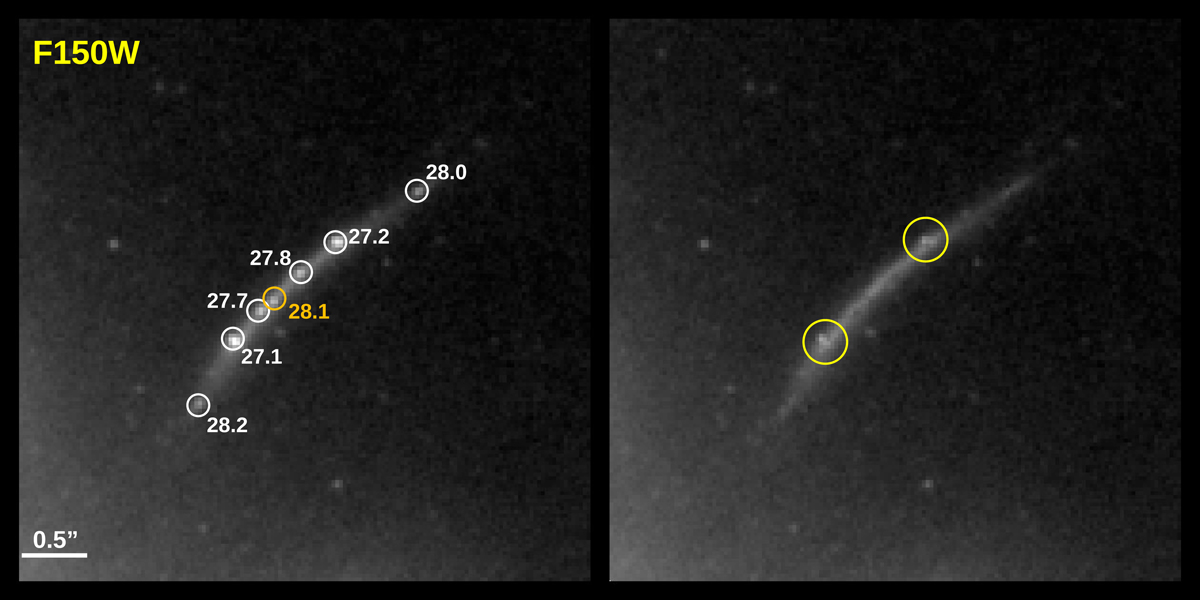
Example of flux estimation using the stacked-star PSF model. The circles mark the positions of seven sources for which the magnitudes were obtained after fitting to the stacked profile of six nearby (unsaturated) stars. The numbers show the estimated magnitude in the F150W band. The left panel shows the original data, and the right panel shows the data after point-source subtraction. LS1 is marked with an orange circle in the left panel. The two yellow circles on the right panel show two regions around the brightest multiply lensed point source, b and b′, where additional unresolved features (also multiply lensed) can still be observed after the source removal. The same feature is observed in other filters suggesting that this is a real feature and not an artifact.
Current usage metrics show cumulative count of Article Views (full-text article views including HTML views, PDF and ePub downloads, according to the available data) and Abstracts Views on Vision4Press platform.
Data correspond to usage on the plateform after 2015. The current usage metrics is available 48-96 hours after online publication and is updated daily on week days.
Initial download of the metrics may take a while.