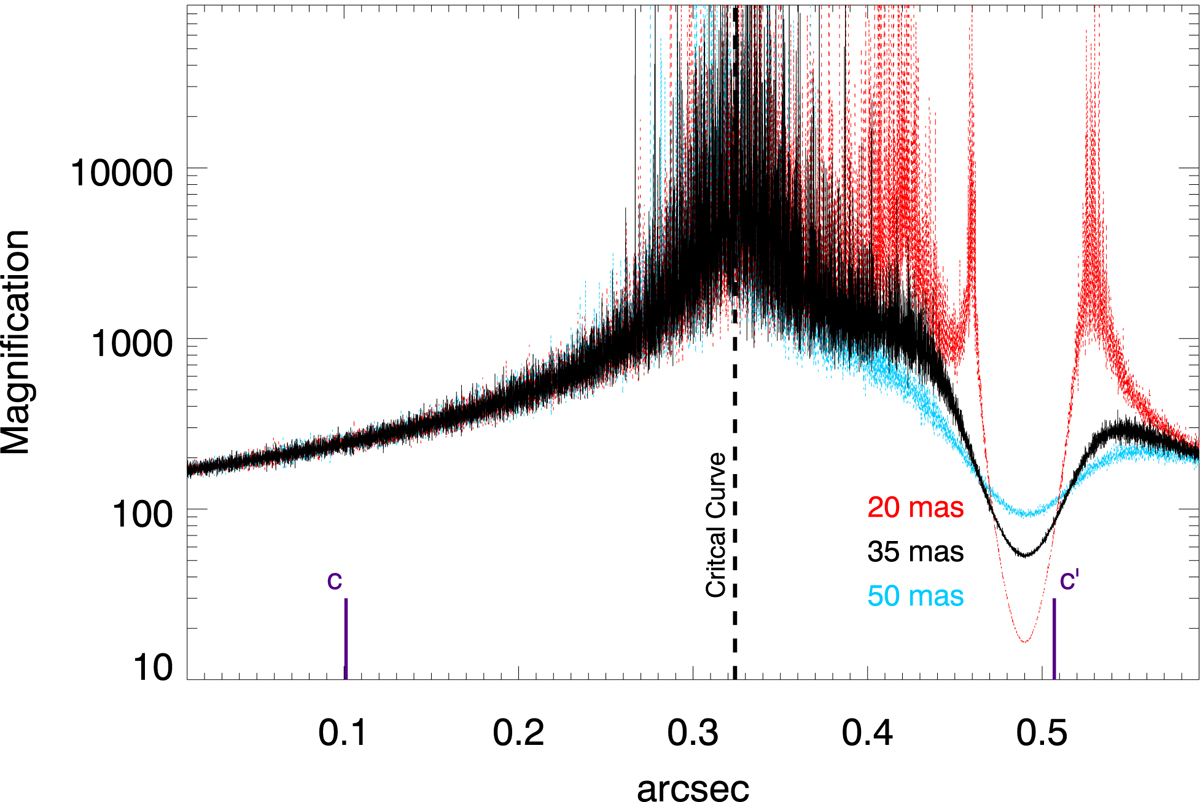
Fig. 17.
Download original image
Magnification of knots c and c′ for the model shown in Fig. 13. The y-axis shows the magnification along lines perpendicular to the critical curve. The small-scale fluctuations are due to microlenses. The position of the critical curve is shown as a vertical dashed line and the positions of c and c′ by vertical solid lines. The black curve shows the magnification along a horizontal line in Fig. 13 crossing 35 mas south of the millilens. The other two lines are at 20 mas and 50 mas as labeled. The three lines cover the range of estimated distances between c′ and the possible millilens.
Current usage metrics show cumulative count of Article Views (full-text article views including HTML views, PDF and ePub downloads, according to the available data) and Abstracts Views on Vision4Press platform.
Data correspond to usage on the plateform after 2015. The current usage metrics is available 48-96 hours after online publication and is updated daily on week days.
Initial download of the metrics may take a while.