Fig. 14.
Download original image
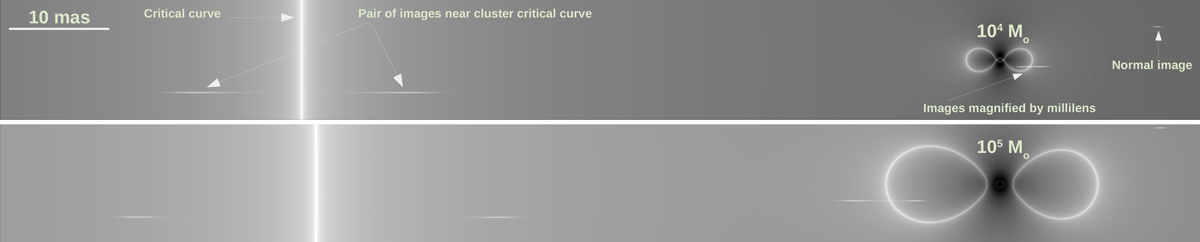
Millilens models near the critical curve. Gray scale shows the logarithm of the magnification at each location with the critical curve from the cluster being the white vertical line and the critical curves from the millilenses being white ovals. Each panel has a millilens 0![]() 07 (about twice the resolving power of JWST) to the right of the macrolens critical curve. The top panel is for a millilens with 104 M⊙, and the bottom panel is for a millilens ten times more massive. (The critical curve in the bottom panel moved toward the right owing to the contribution of the millilens to the total convergence). Three sources, modeled as Gaussians with σ = 2 μas = 0.0168 pc and marked with arrows, are being lensed. The source labeled “normal image” is far from the critical curve and magnified by the cluster macrolens with only a small contribution from the millilens. The source labeled “Images magnified by millilens” is magnified by the millilens. The source labeled “Pair of images near cluster critical curve” is close to the caustic of the cluster and forms a pair of images.
07 (about twice the resolving power of JWST) to the right of the macrolens critical curve. The top panel is for a millilens with 104 M⊙, and the bottom panel is for a millilens ten times more massive. (The critical curve in the bottom panel moved toward the right owing to the contribution of the millilens to the total convergence). Three sources, modeled as Gaussians with σ = 2 μas = 0.0168 pc and marked with arrows, are being lensed. The source labeled “normal image” is far from the critical curve and magnified by the cluster macrolens with only a small contribution from the millilens. The source labeled “Images magnified by millilens” is magnified by the millilens. The source labeled “Pair of images near cluster critical curve” is close to the caustic of the cluster and forms a pair of images.
Current usage metrics show cumulative count of Article Views (full-text article views including HTML views, PDF and ePub downloads, according to the available data) and Abstracts Views on Vision4Press platform.
Data correspond to usage on the plateform after 2015. The current usage metrics is available 48-96 hours after online publication and is updated daily on week days.
Initial download of the metrics may take a while.