Fig. 10.
Download original image
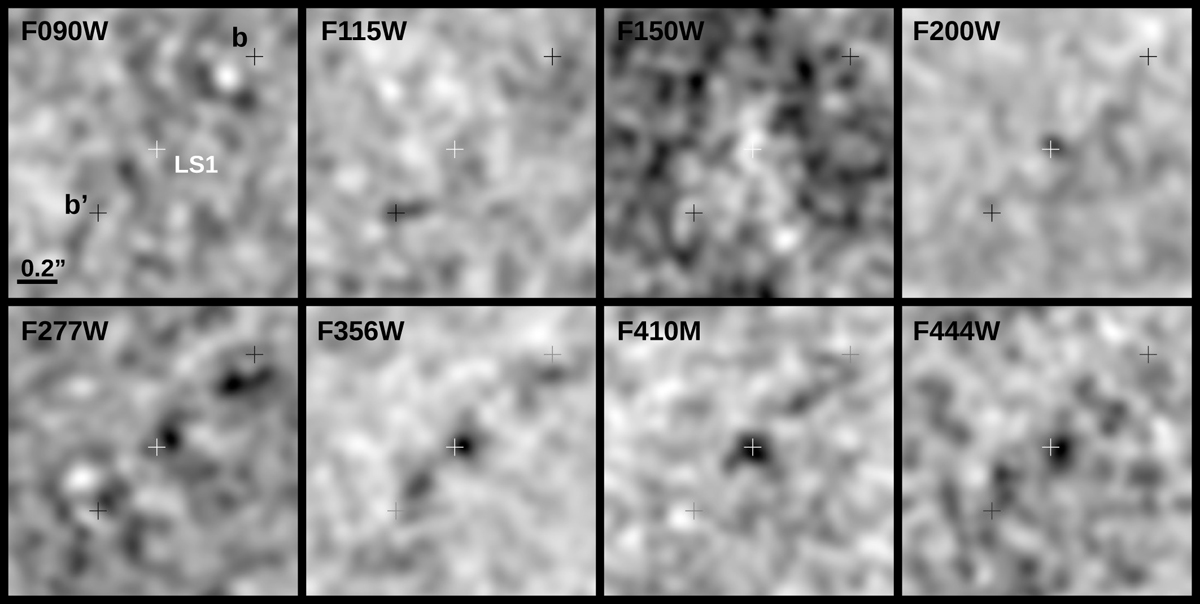
Difference images between first and last epochs. Each panel shows a region of ![]() centered on LS1 and in filters as labeled in each panel. A source that brightened between the two epochs shows up as dark in the figure. White crosses mark the position of LS1, and black crosses mark the positions of knot b and its equally bright counterimage b′. All images have been smoothed with a Gaussian kernel with
centered on LS1 and in filters as labeled in each panel. A source that brightened between the two epochs shows up as dark in the figure. White crosses mark the position of LS1, and black crosses mark the positions of knot b and its equally bright counterimage b′. All images have been smoothed with a Gaussian kernel with ![]() to increase contrast.
to increase contrast.
Current usage metrics show cumulative count of Article Views (full-text article views including HTML views, PDF and ePub downloads, according to the available data) and Abstracts Views on Vision4Press platform.
Data correspond to usage on the plateform after 2015. The current usage metrics is available 48-96 hours after online publication and is updated daily on week days.
Initial download of the metrics may take a while.