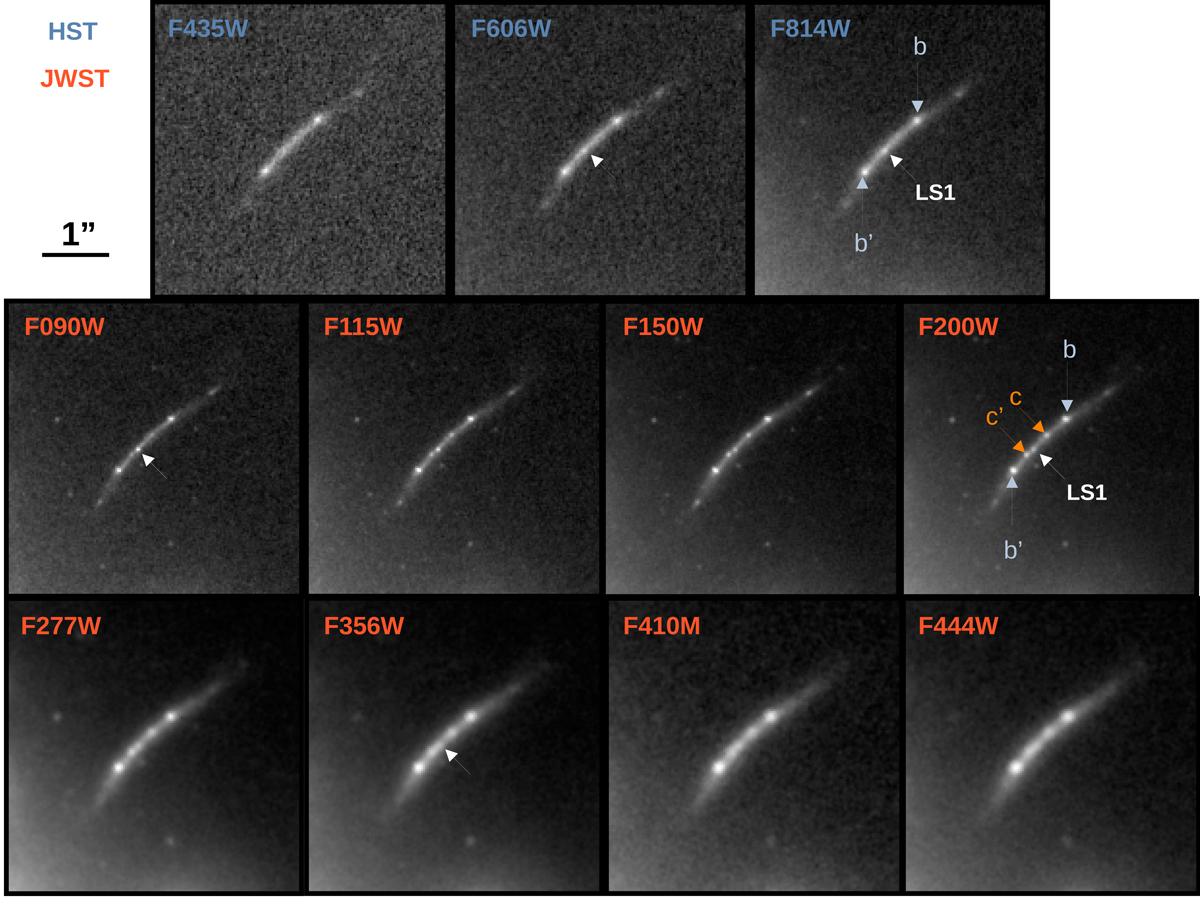
Fig. 1.
Download original image
HST and JWST images of the arc hosting LS1. All panels are labeled with the image’s filter, and the positions of LS1 and two multiply imaged knots (b and b′, c and c′) are marked in some panels. Unlabeled arrows point to LS1. A scale bar is to the left of the top row. The top three panels show the ACS data taken in 2014 for the HFF project. The 2022–2023 NIRCam data (three epochs combined) are shown in the middle and bottom rows. These are the discovery images for knots c and c′.
Current usage metrics show cumulative count of Article Views (full-text article views including HTML views, PDF and ePub downloads, according to the available data) and Abstracts Views on Vision4Press platform.
Data correspond to usage on the plateform after 2015. The current usage metrics is available 48-96 hours after online publication and is updated daily on week days.
Initial download of the metrics may take a while.