Fig. 8
Download original image
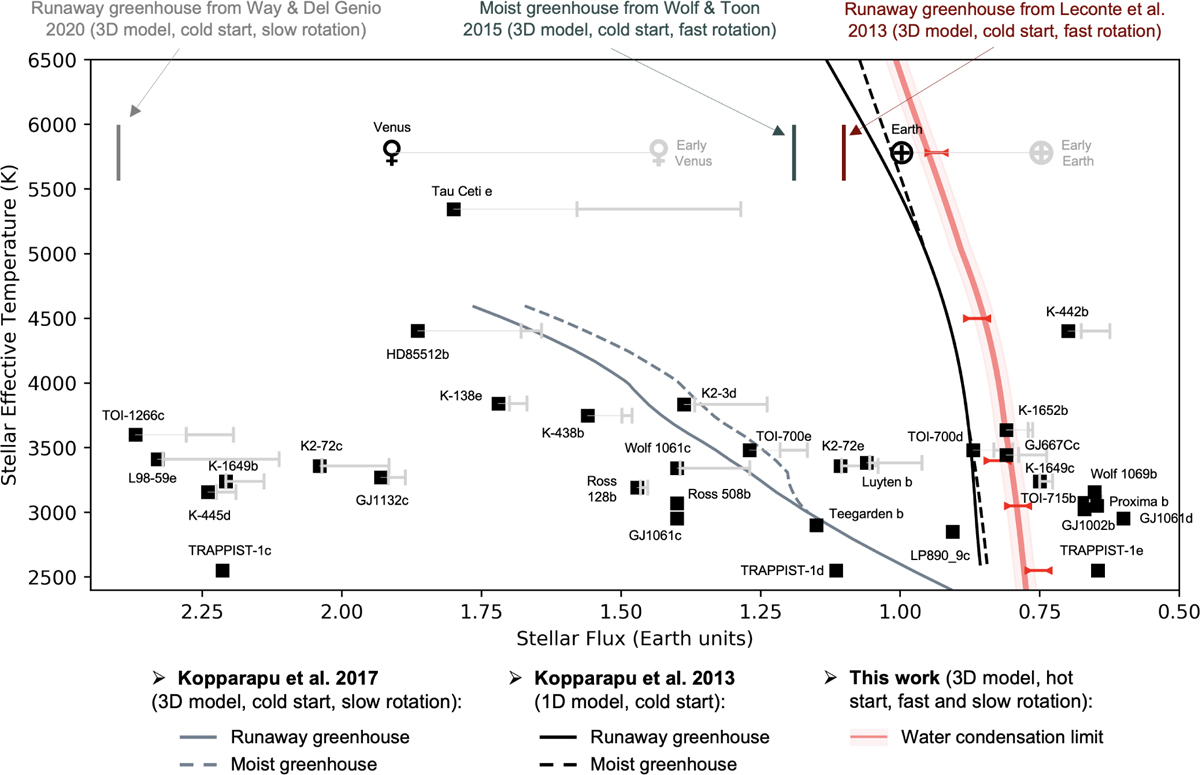
Various inner edge boundaries of the habitable zone (HZ) for different types of stars, based on the results of 1D calculations (Kopparapu et al. 2013) and 3D calculations for slow (Kopparapu et al. 2017; Way & Del Genio 2020) and fast rotators (Leconte et al. 2013a; Wolf & Toon 2015). The black solid and dashed lines were calculated based on 1D climate calculations, for the runaway greenhouse effect and the moist greenhouse effect, respectively (Kopparapu et al. 2013). The gray solid and dashed lines were calculated based on 3D climate calculations of tidally locked planets, for the runaway greenhouse effect and the moist greenhouse effect, respectively (Kopparapu et al. 2017). The red bold line (and red brackets) indicates the newly calculated water condensation limit. All the currently known planets and exoplanets (with a mass ≤ 5 M⊕ and/or a radius ≤ 1.6 R⊕) in or near the inner boundary of the HZ are shown (black squares). Also shown (gray brackets) are the incoming stellar radiation (ISR) they received at the ZAMS based on their age estimates, using the grid of stellar models of Baraffe et al. (2015). The water condensation limit (red bold line) should be compared with the ISR that planets received at the ZAMS (gray brackets).
Current usage metrics show cumulative count of Article Views (full-text article views including HTML views, PDF and ePub downloads, according to the available data) and Abstracts Views on Vision4Press platform.
Data correspond to usage on the plateform after 2015. The current usage metrics is available 48-96 hours after online publication and is updated daily on week days.
Initial download of the metrics may take a while.