Fig. 6
Download original image
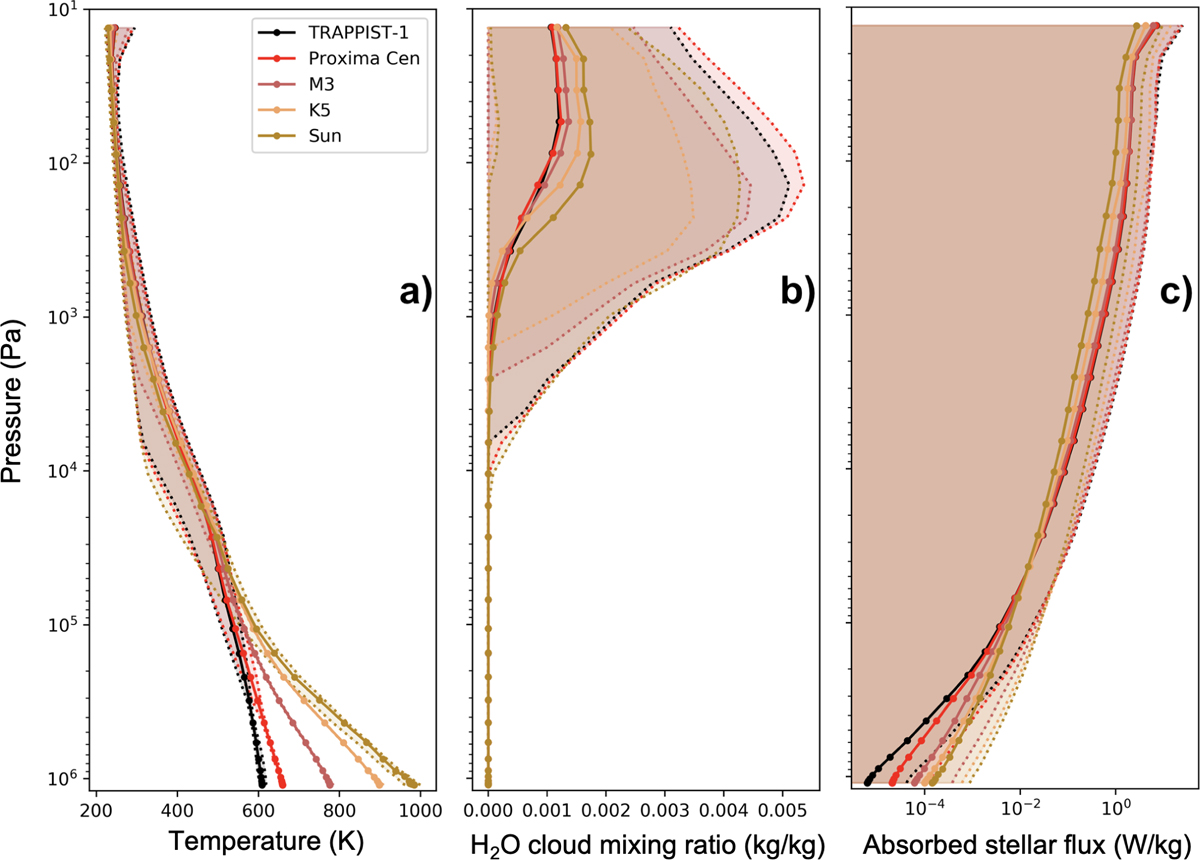
Vertical profiles (global mean, envelope defined by global maximum and minimum values) of atmospheric temperatures (left), water cloud mixing ratio (middle), and absorbed stellar fluxes (right). The profiles were computed for an initially hot and steamy 1 R⊕ planet (with a 10 bar H2O + 1 bar N2 atmosphere) orbiting around different types of stars: TRAPPIST-1 (T★ ~ 2600 K), Proxima Centauri (T★ ~ 3050 K), an M3 star (T★ ~ 3400 K), a K5 star (T★ ~ 4400 K), and the Sun (T★ ~ 5780 K). The curves were drawn from the same GCM simulations as in Fig. 4. The associated simulations names are T1-1, Pcen-1, M3-1, K5-1, and SUN-1, respectively.
Current usage metrics show cumulative count of Article Views (full-text article views including HTML views, PDF and ePub downloads, according to the available data) and Abstracts Views on Vision4Press platform.
Data correspond to usage on the plateform after 2015. The current usage metrics is available 48-96 hours after online publication and is updated daily on week days.
Initial download of the metrics may take a while.