Fig. 2
Download original image
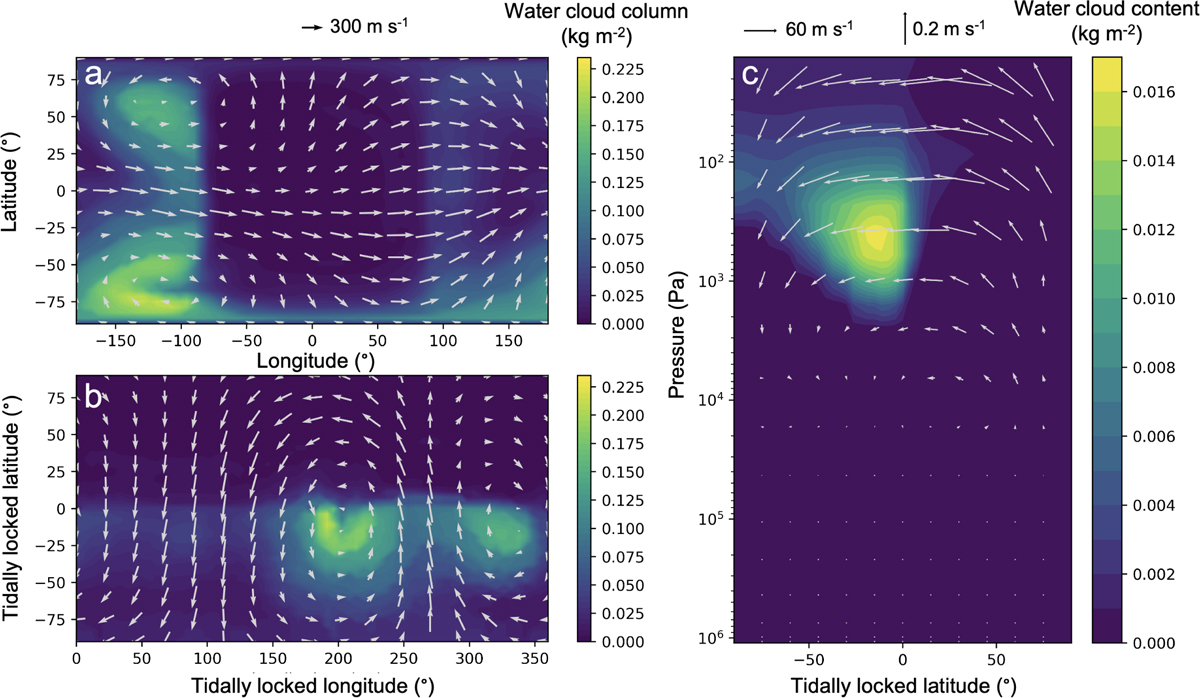
Water cloud horizontal and vertical distributions. Water cloud Col. (a) in latitude vs. longitude coordinates and (b) tidally locked (TL) coordinates (b). Water cloud content vertical distribution (c) as a function of TL latitude (averaged over all TL longitudes). The plots were computed for an initially hot and steamy 2 R⊕ planet (with a 10 bar H2O + 1 bar N2 atmosphere) synchronously rotating (fixed rotation period of 60 Earth days) around an M3 star, and forced to an ISR of 500 W m−2 (simulation M3-YANG-1). The outputs were averaged over 250 Earth days. For reference, insolation is 340.5 W m−2 on present-day Earth. Wind fields are superimposed on the plots. Winds are plotted at a pressure of ~50 Pa in panels a and b, and averaged over all TL longitudes in panel c.
Current usage metrics show cumulative count of Article Views (full-text article views including HTML views, PDF and ePub downloads, according to the available data) and Abstracts Views on Vision4Press platform.
Data correspond to usage on the plateform after 2015. The current usage metrics is available 48-96 hours after online publication and is updated daily on week days.
Initial download of the metrics may take a while.