Fig. 14
Download original image
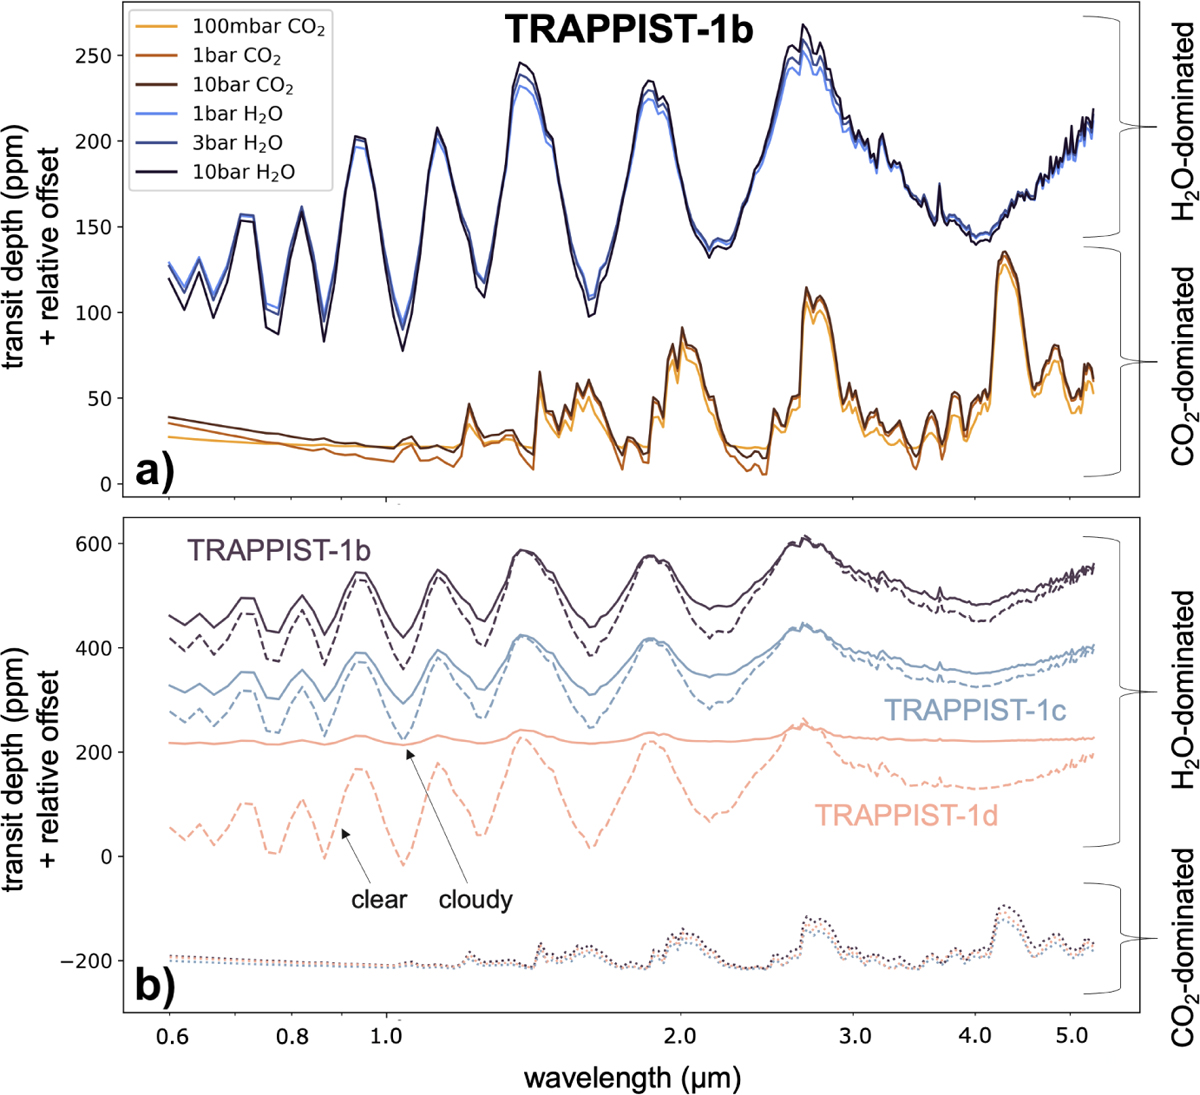
Various transit spectra computed with PSG for the three innermost planets of the TRAPPIST-1 system calculated from 3D GCM simulations (assuming H2O-dominated composition, and also CO2-dominated for comparison). In the upper panel a, transit spectra of TRAPPIST-1b for various compositions and pressures are compared; in the lower panel b, transit spectra of TRAPPIST-1b, c, and d for two compositions only (10 bar H2O + 1 bar N2; 10 bar CO2) are compared. The dashed lines indicate H2O cloud-free atmospheres, while solid lines assume H2O cloudy atmospheres. The dotted lines indicate CO2 atmospheres (including the effect of CO2 ice clouds, although extremely limited here; instead, CO2 condensation was cut off for TRAPPIST-1b and c simulations with 100 mbar of CO2 as this would cause the atmosphere to collapse on the nightside.). These are relative transit depths; the curves are shifted with arbitrary offsets to compare them more easily.
Current usage metrics show cumulative count of Article Views (full-text article views including HTML views, PDF and ePub downloads, according to the available data) and Abstracts Views on Vision4Press platform.
Data correspond to usage on the plateform after 2015. The current usage metrics is available 48-96 hours after online publication and is updated daily on week days.
Initial download of the metrics may take a while.