Fig. 12
Download original image
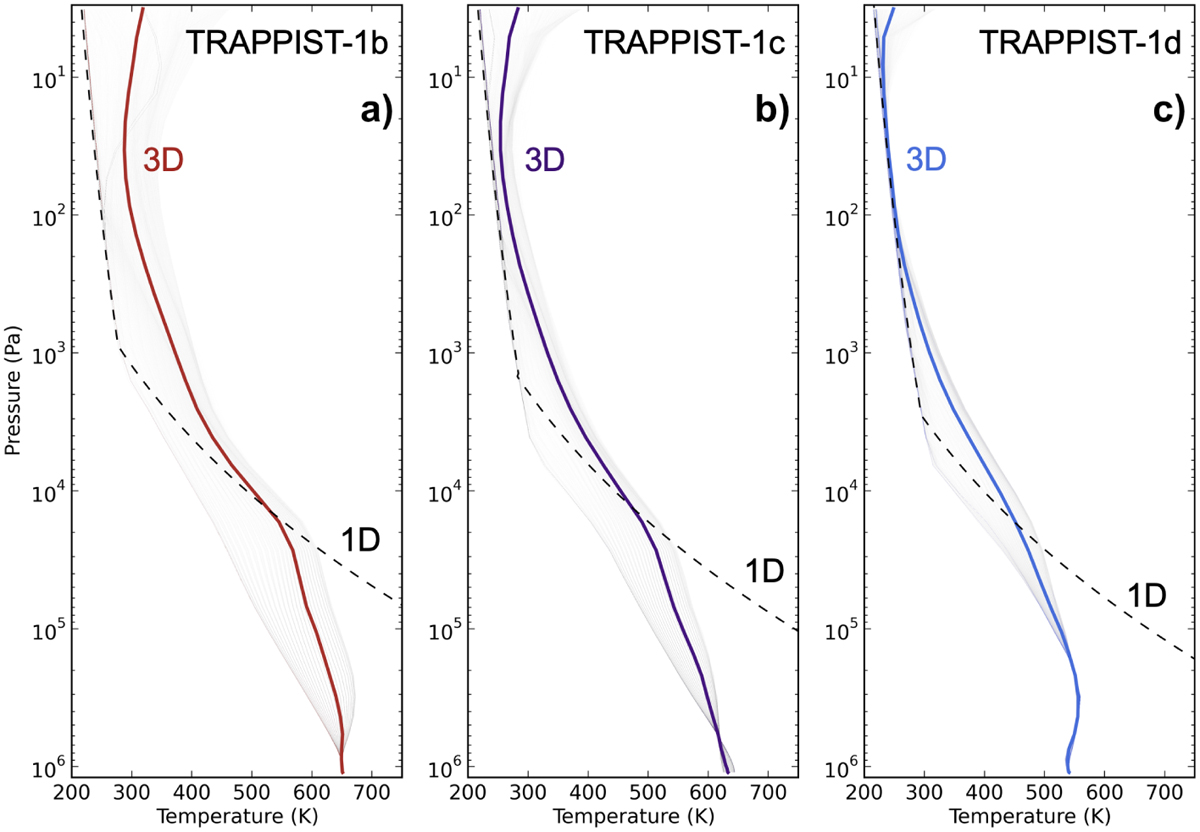
Temperature vertical profiles for TRAPPIST-1b (left), TRAPPIST-1c (middle), and TRAPPIST-1d (right). The associated simulation names are T1b, T1c, and T1d, respectively. The solid lines are global mean, temporal average (over 100 Earth days) temperature profiles calculated from GCM simulations. The shaded lines are snapshots taken at different latitude and longitude points to show the range of profiles within a simulation. The dashed lines are calculated with a 1D inverse radiative-convective model (Turbet et al. 2019, 2020b) similar to those used in Kopparapu et al. (2013) to calculate the inner edge of the HZ.
Current usage metrics show cumulative count of Article Views (full-text article views including HTML views, PDF and ePub downloads, according to the available data) and Abstracts Views on Vision4Press platform.
Data correspond to usage on the plateform after 2015. The current usage metrics is available 48-96 hours after online publication and is updated daily on week days.
Initial download of the metrics may take a while.