Fig. 5
Download original image
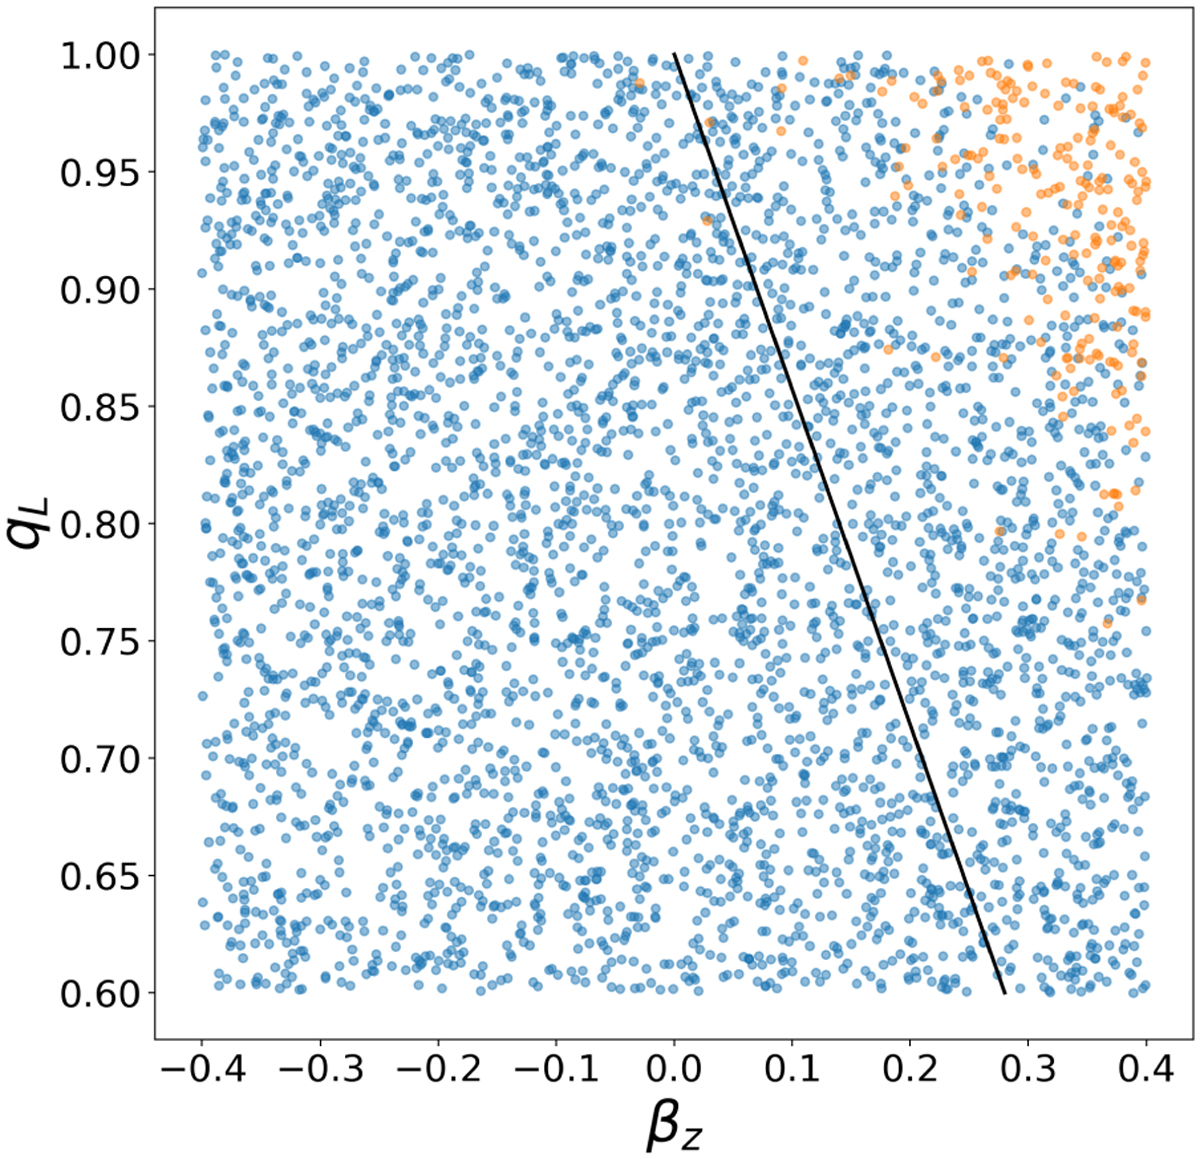
Scatter plot where each point represents the input parameters for each of the 4000 test-set images. Maps with zero-valued pixels (orange) are predominately confined to a small region of parameter space with high βz and qL, compared to those with nonzero pixel values (blue). The black line indicates the cutoff of Cappellari (2016), above which ETGs have not been observed.
Current usage metrics show cumulative count of Article Views (full-text article views including HTML views, PDF and ePub downloads, according to the available data) and Abstracts Views on Vision4Press platform.
Data correspond to usage on the plateform after 2015. The current usage metrics is available 48-96 hours after online publication and is updated daily on week days.
Initial download of the metrics may take a while.