Fig. 2
Download original image
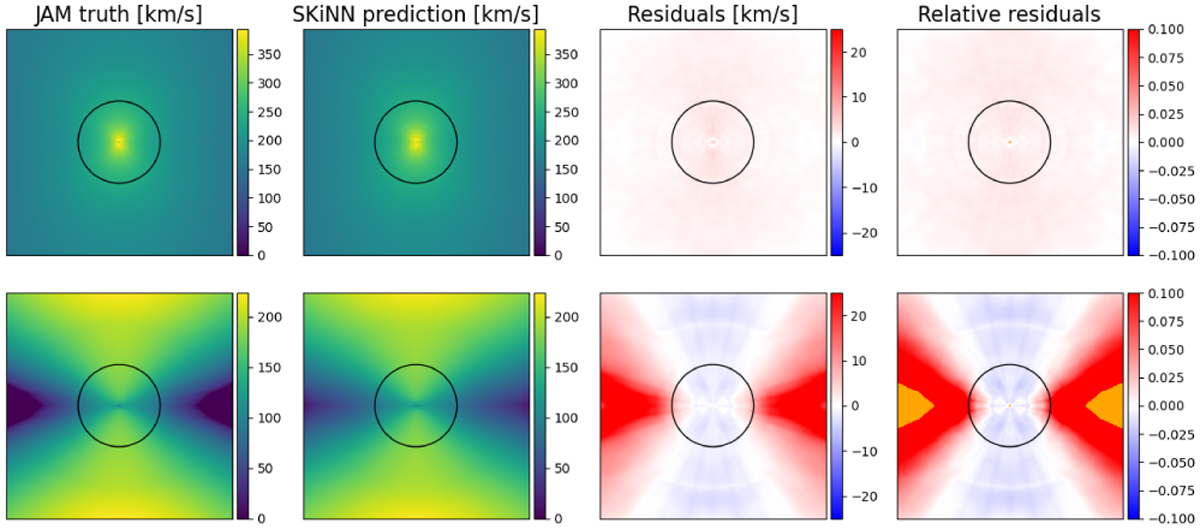
Accuracy of SKiNN emulation of υrms maps in a typical case (top) and in a particularly poor case (bottom). The first two columns give the truth and predicted υrms maps. Residual differences (third column, km s−1) and relative residuals, evaluated as (prediction–truth)/truth (fourth column) are also plotted. Where pixels have zero values, relative residuals are shown in orange. The black circle corresponds to a 2″ radius, inside which real data are most constraining.
Current usage metrics show cumulative count of Article Views (full-text article views including HTML views, PDF and ePub downloads, according to the available data) and Abstracts Views on Vision4Press platform.
Data correspond to usage on the plateform after 2015. The current usage metrics is available 48-96 hours after online publication and is updated daily on week days.
Initial download of the metrics may take a while.