Fig. 3.
Download original image
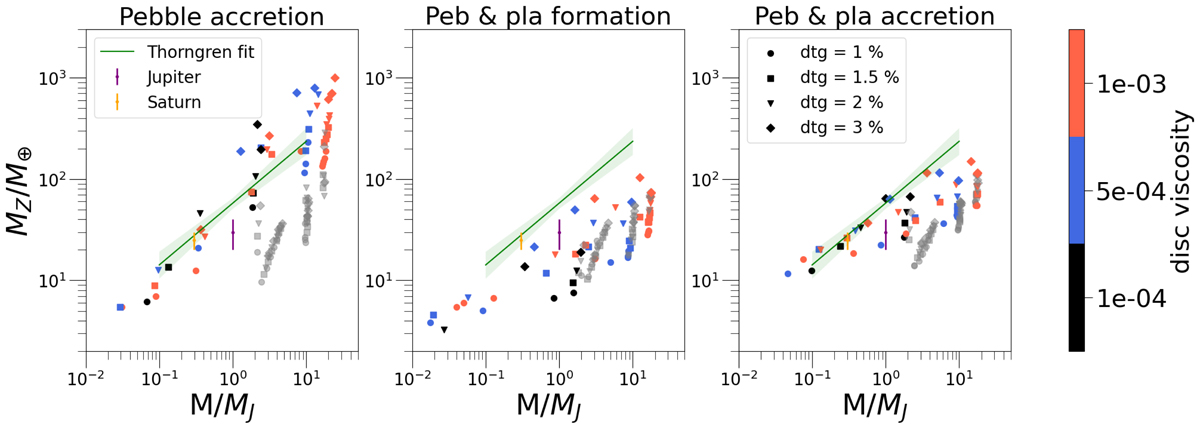
Total heavy element content of the planets with final mass M > 5M⊕ and position ap < 1 AU as a function of the total mass for the three formation scenarios. The colour-coding represents the different viscosities, while the different markers indicate the different initial dust-to-gas ratios of the disc. The green line is the fit from Thorngren et al. (2016), while Jupiter and Saturn are in purple and orange, respectively. The grey points represent planets that end up with ap > 1 AU from the central star.
Current usage metrics show cumulative count of Article Views (full-text article views including HTML views, PDF and ePub downloads, according to the available data) and Abstracts Views on Vision4Press platform.
Data correspond to usage on the plateform after 2015. The current usage metrics is available 48-96 hours after online publication and is updated daily on week days.
Initial download of the metrics may take a while.