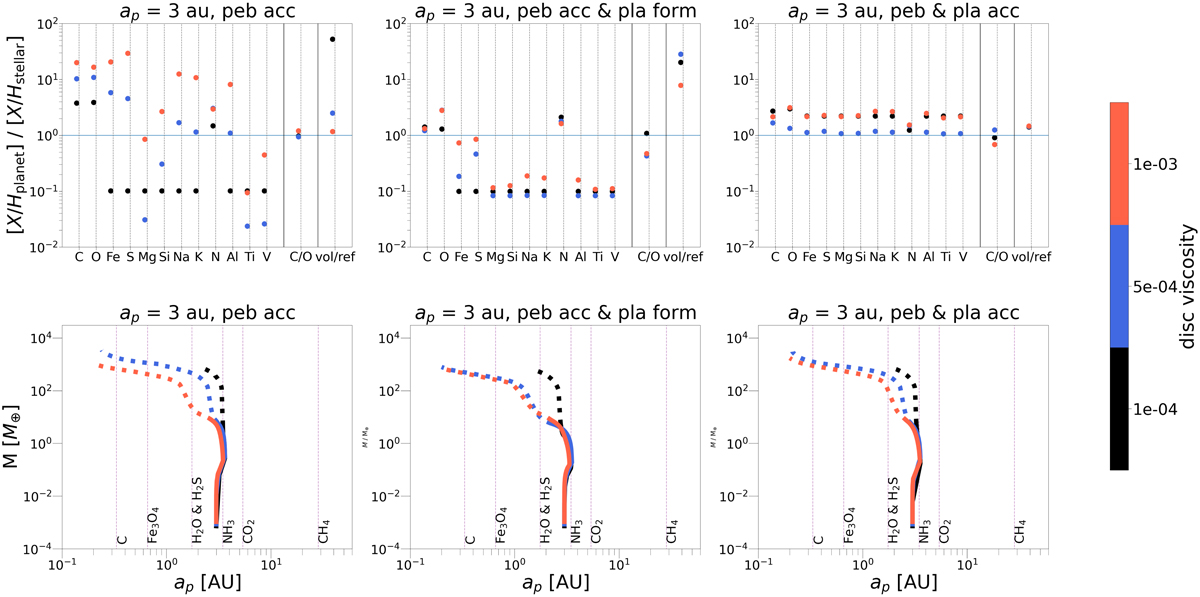
Fig. 2.
Download original image
Final elemental abundances of the planetary atmospheres (top) and their corresponding growth tracks (bottom) for three different scenarios: pebble accretion-only (left), planetesimal formation (middle), and pebble and planetesimal accretion (right). The horizontal blue line in the first row indicates the solar abundance, while the vertical violet lines in the second row show the evaporation fronts of the chemical species included in our model for a disc viscosity of α = 5 × 10⁻⁴. The solid lines of the growth tracks correspond to core formation, while the dotted lines correspond to the gas accretion phase. The disc viscosities are colour-coded following the scale at the right.
Current usage metrics show cumulative count of Article Views (full-text article views including HTML views, PDF and ePub downloads, according to the available data) and Abstracts Views on Vision4Press platform.
Data correspond to usage on the plateform after 2015. The current usage metrics is available 48-96 hours after online publication and is updated daily on week days.
Initial download of the metrics may take a while.