Fig. 2
Download original image
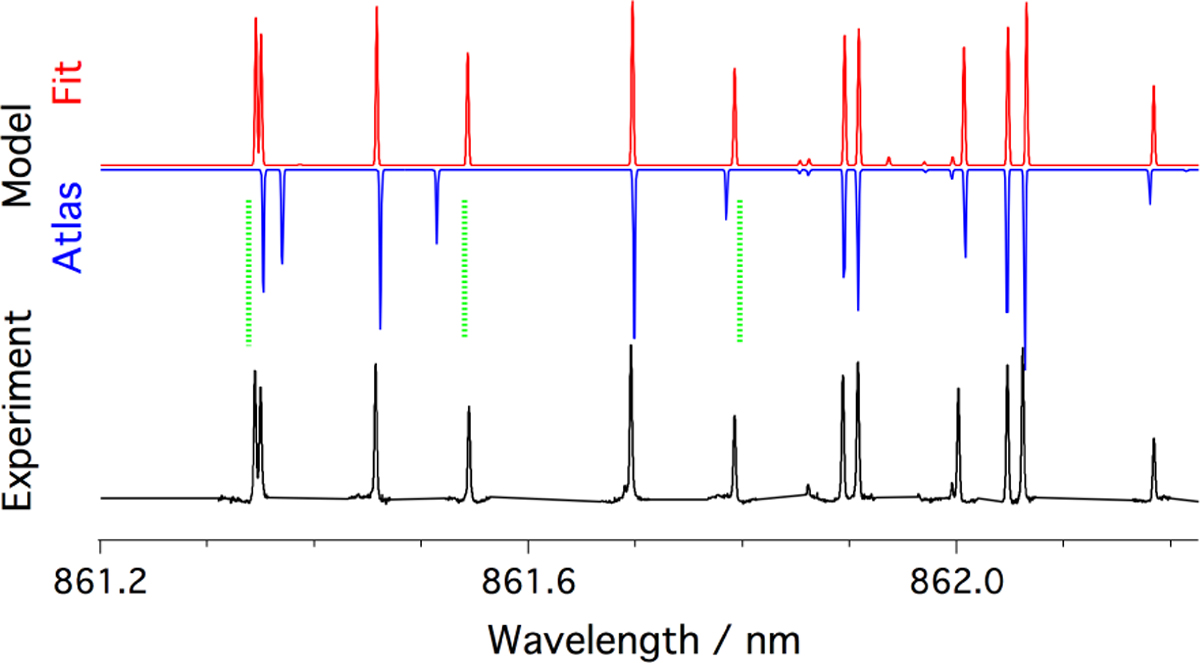
R-head region of the 0-0 band of 52CrH A-X, at arbitrary scale. Shown in red is our fit, N′ < 15. In blue is the calculated absorption cross-sections from the ExoMol software (Tennyson et al. 2020) based on the data from Burrows et al. (2002); the full intensity scale for the strongest line shown is 8 × 10⁻¹⁵ cm2 molecule−1. A laboratory spectrum is shown in black. Dashed green lines indicate significant improvements in our model.
Current usage metrics show cumulative count of Article Views (full-text article views including HTML views, PDF and ePub downloads, according to the available data) and Abstracts Views on Vision4Press platform.
Data correspond to usage on the plateform after 2015. The current usage metrics is available 48-96 hours after online publication and is updated daily on week days.
Initial download of the metrics may take a while.