Fig. 11
Download original image
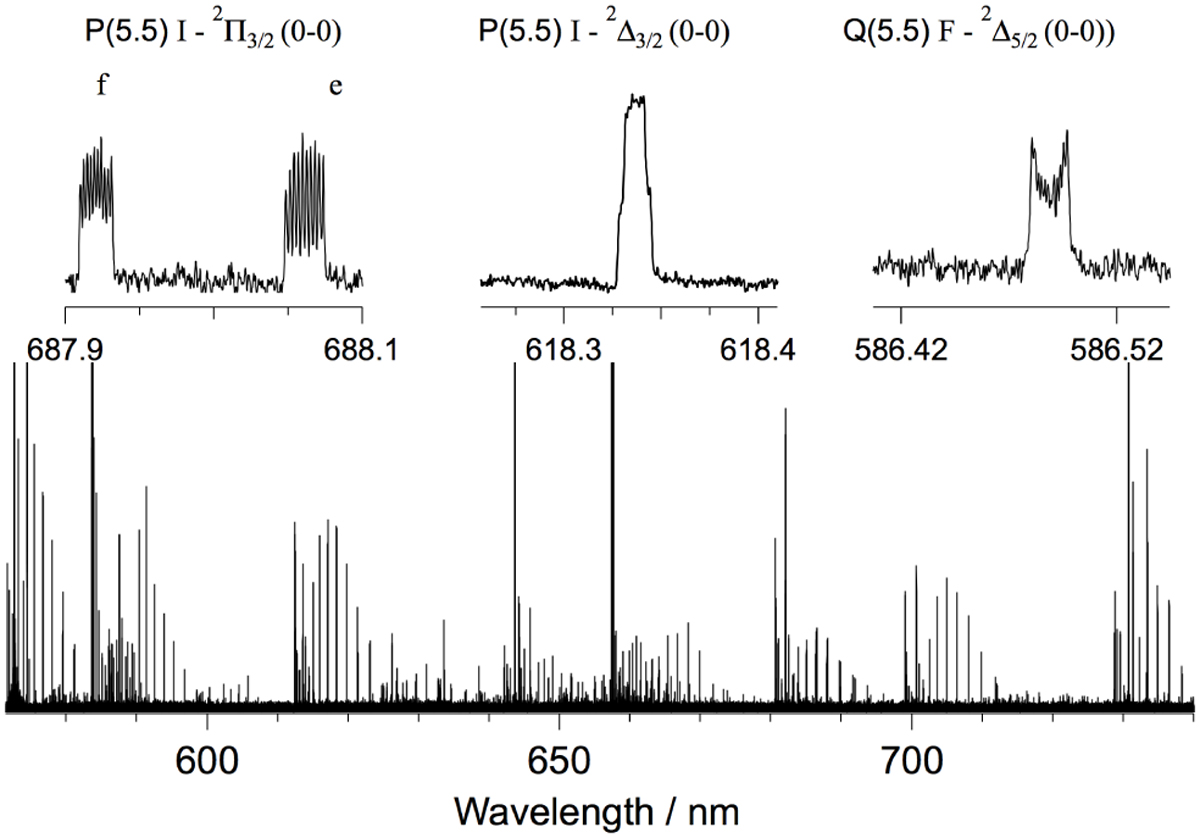
Laboratory fluorescence spectrum of NiH recorded at 0.7 T. The upper graphs show three individual lines in 4.5 cm−1 windows to illustrate the difference in Zeeman response at a given rotational quantum number in three electronic systems. Note that the Zeeman patterns differ even for the two Λ-doublet components of the P(5.5) line, in the top-left plot.
Current usage metrics show cumulative count of Article Views (full-text article views including HTML views, PDF and ePub downloads, according to the available data) and Abstracts Views on Vision4Press platform.
Data correspond to usage on the plateform after 2015. The current usage metrics is available 48-96 hours after online publication and is updated daily on week days.
Initial download of the metrics may take a while.