Fig. 9.
Download original image
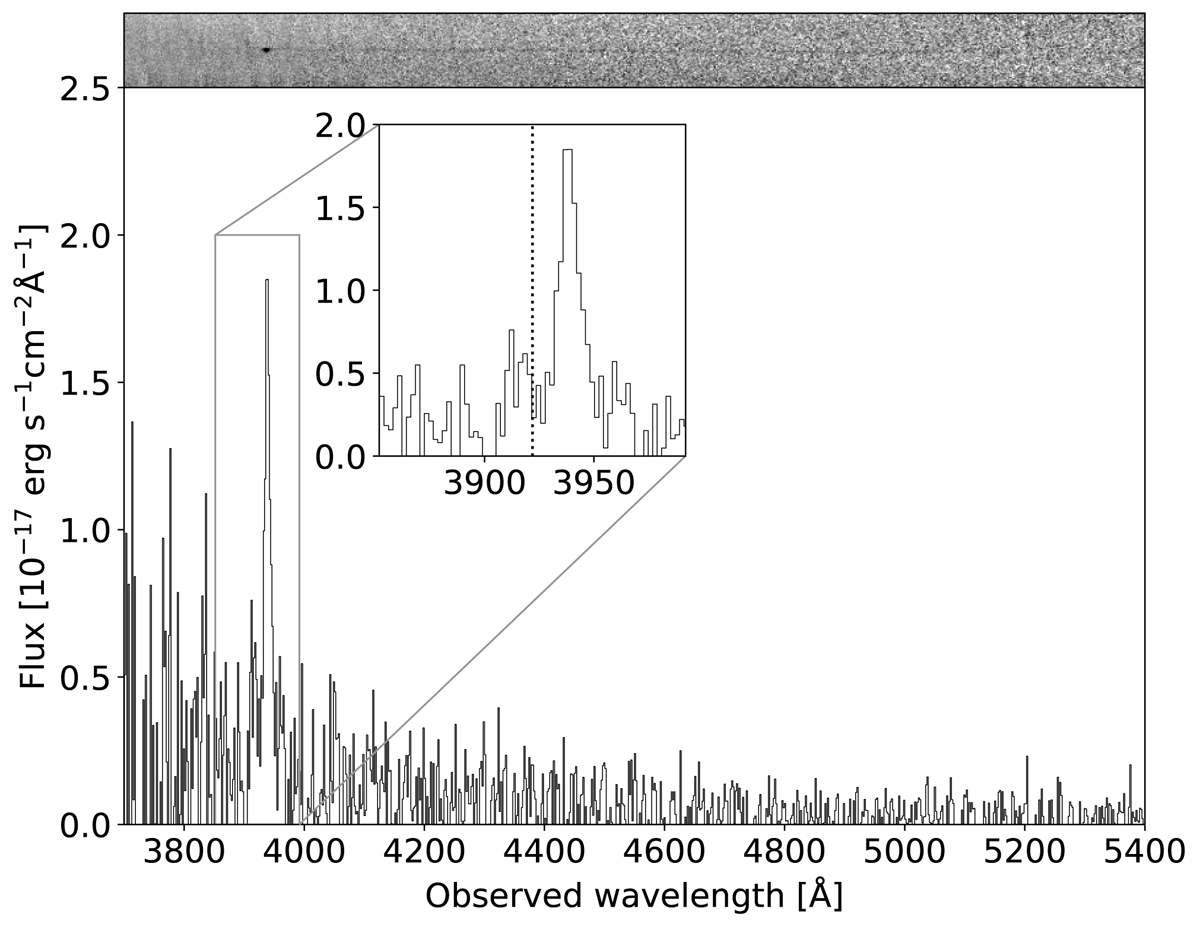
Blue end of the OSIRIS/R1000B spectrum of the bright Lyman-α marked S in Fig. 2. The top panel shows the two-dimensional spectrum and the bottom panel the extracted one-dimensional spectrum. A single bright emission line was detected at 3937.8 ± 0.4 Å on top of a blue continuum. The inset shows a zoom-in on the line where the dotted line shows the position of Lyman-alpha centred at z = 2.2261.
Current usage metrics show cumulative count of Article Views (full-text article views including HTML views, PDF and ePub downloads, according to the available data) and Abstracts Views on Vision4Press platform.
Data correspond to usage on the plateform after 2015. The current usage metrics is available 48-96 hours after online publication and is updated daily on week days.
Initial download of the metrics may take a while.