Open Access
Fig. 6.
Download original image
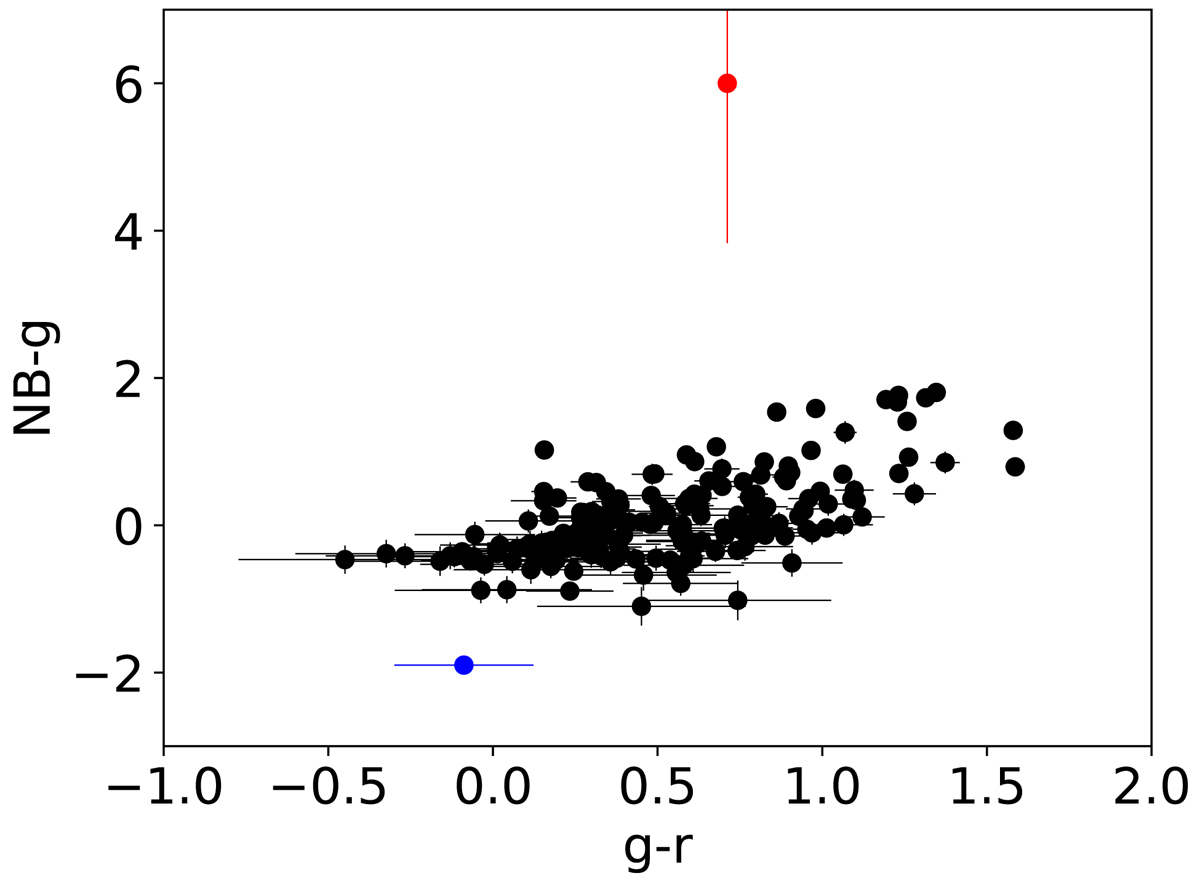
Colour-colour diagram based on the NOT imaging in the g and r filters and the NB391_7 filter. Two objects stand out, namely Q 1218+0832 (marked in red), which has a deficit of flux in the narrow filter, and an emission line source, marked in blue, with excess emission in the narrow filter.
Current usage metrics show cumulative count of Article Views (full-text article views including HTML views, PDF and ePub downloads, according to the available data) and Abstracts Views on Vision4Press platform.
Data correspond to usage on the plateform after 2015. The current usage metrics is available 48-96 hours after online publication and is updated daily on week days.
Initial download of the metrics may take a while.