Fig. 4
Download original image
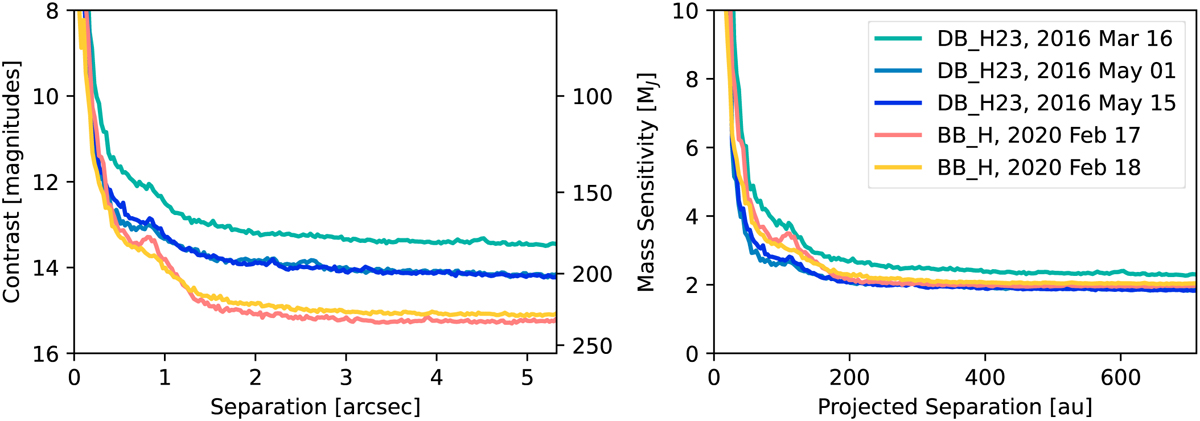
Contrast (left) and mass sensitivities (right) of each epoch of observations. The legend applies to both figures; cool colors indicate the narrowband DB_H23 observations and warm colors indicate the broadband BB_H observations. Companion magnitude limits were converted to mass limits using the ATMO models from Phillips et al. (2020).
Current usage metrics show cumulative count of Article Views (full-text article views including HTML views, PDF and ePub downloads, according to the available data) and Abstracts Views on Vision4Press platform.
Data correspond to usage on the plateform after 2015. The current usage metrics is available 48-96 hours after online publication and is updated daily on week days.
Initial download of the metrics may take a while.