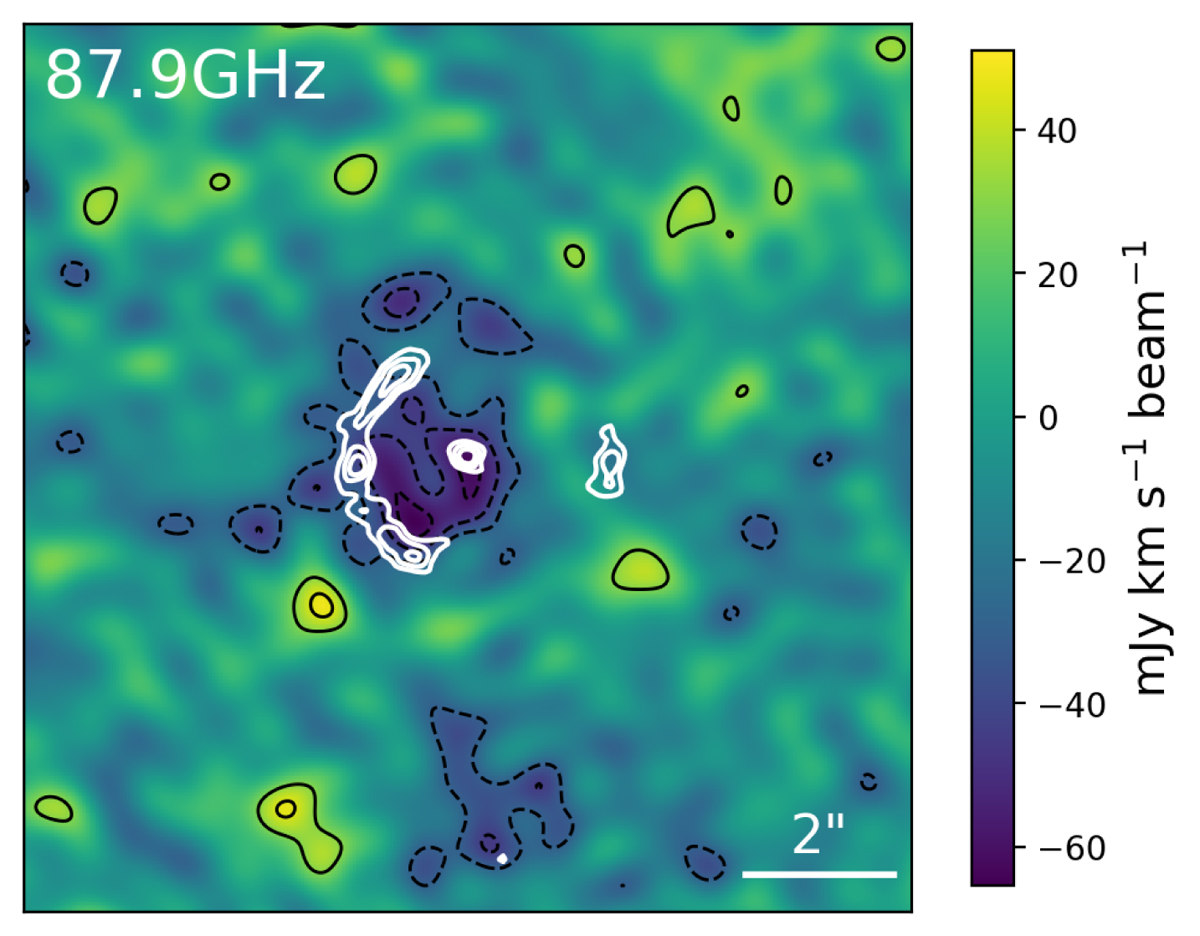
Fig. A.1.
Download original image
Image of the absorption feature at 87.9 GHz, made from the continuum-subtracted data using a 250-kλ uv-distance cut. The black contours start at ±2σ and increase in steps of 1σ, white contours indicate the Band 3 continuum. The absorption is not associated with the lensing arcs and is most likely due to a foreground CO(0–1) absorber at z ≈ 0.31.
Current usage metrics show cumulative count of Article Views (full-text article views including HTML views, PDF and ePub downloads, according to the available data) and Abstracts Views on Vision4Press platform.
Data correspond to usage on the plateform after 2015. The current usage metrics is available 48-96 hours after online publication and is updated daily on week days.
Initial download of the metrics may take a while.