Fig. 6.
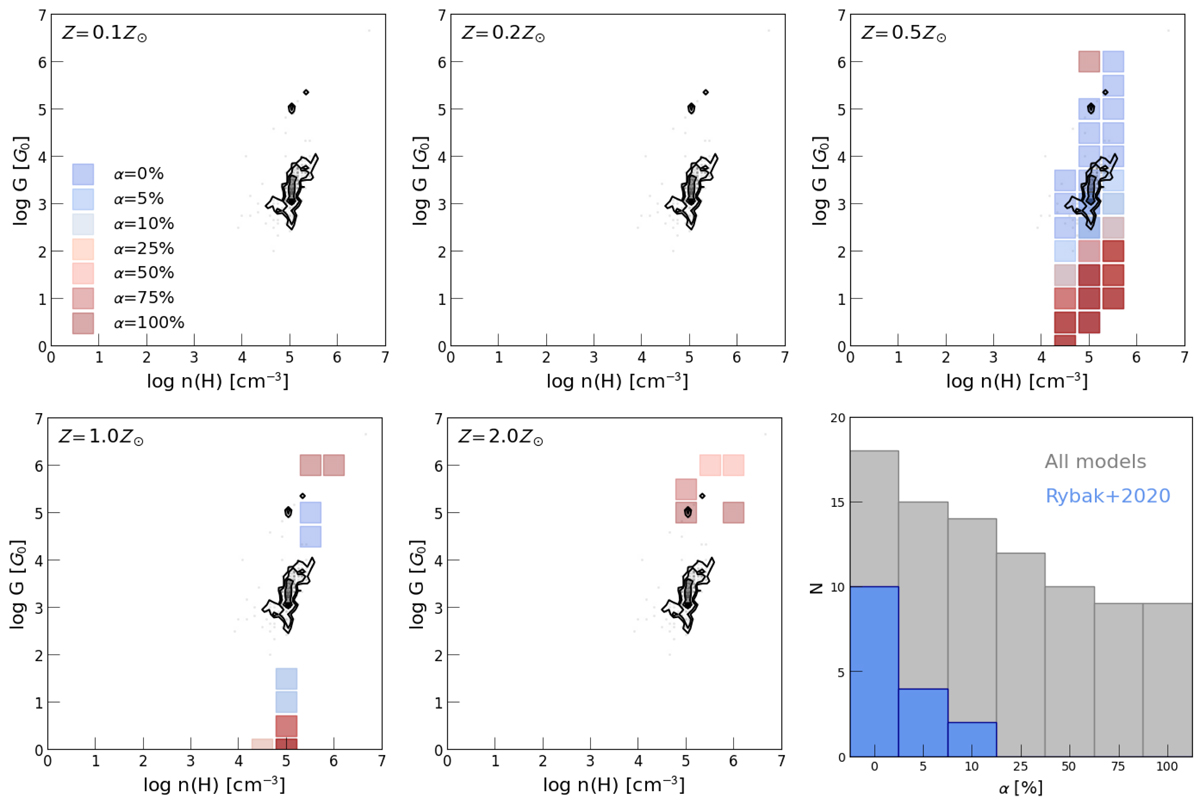
Download original image
Far-UV radiation (G) and gas density (n) from PDR models, with constraints from the HCN, HCO+, HNC, and CO(5–4) observations. Individual panels show models for Z = 0.1, 0.2, 0.5, 1.0, 2.0 Z⊙. Different colours denote the different levels of mechanical heating contribution α (0%–100%); the coloured squares denote models consistent with the observed line ratios within 50%; grey shaded contours show the G and n inferred from high-resolution imaging of SDP.81 by Rybak et al. (2020). Only the Z = 0.5 Z⊙, α = 0, 10% models are consistent with the data. The most direct interpretation is that SDP.81 has sub-solar metallicity and only limited mechanical heating. Lower right: histogram of mechanical heating factor α for the Z = 0.5 Z⊙ model. All PDR models consistent with the line data are shown in grey; the models consistent with G and n inferred from Rybak et al. (2020) are highlighted in blue.
Current usage metrics show cumulative count of Article Views (full-text article views including HTML views, PDF and ePub downloads, according to the available data) and Abstracts Views on Vision4Press platform.
Data correspond to usage on the plateform after 2015. The current usage metrics is available 48-96 hours after online publication and is updated daily on week days.
Initial download of the metrics may take a while.