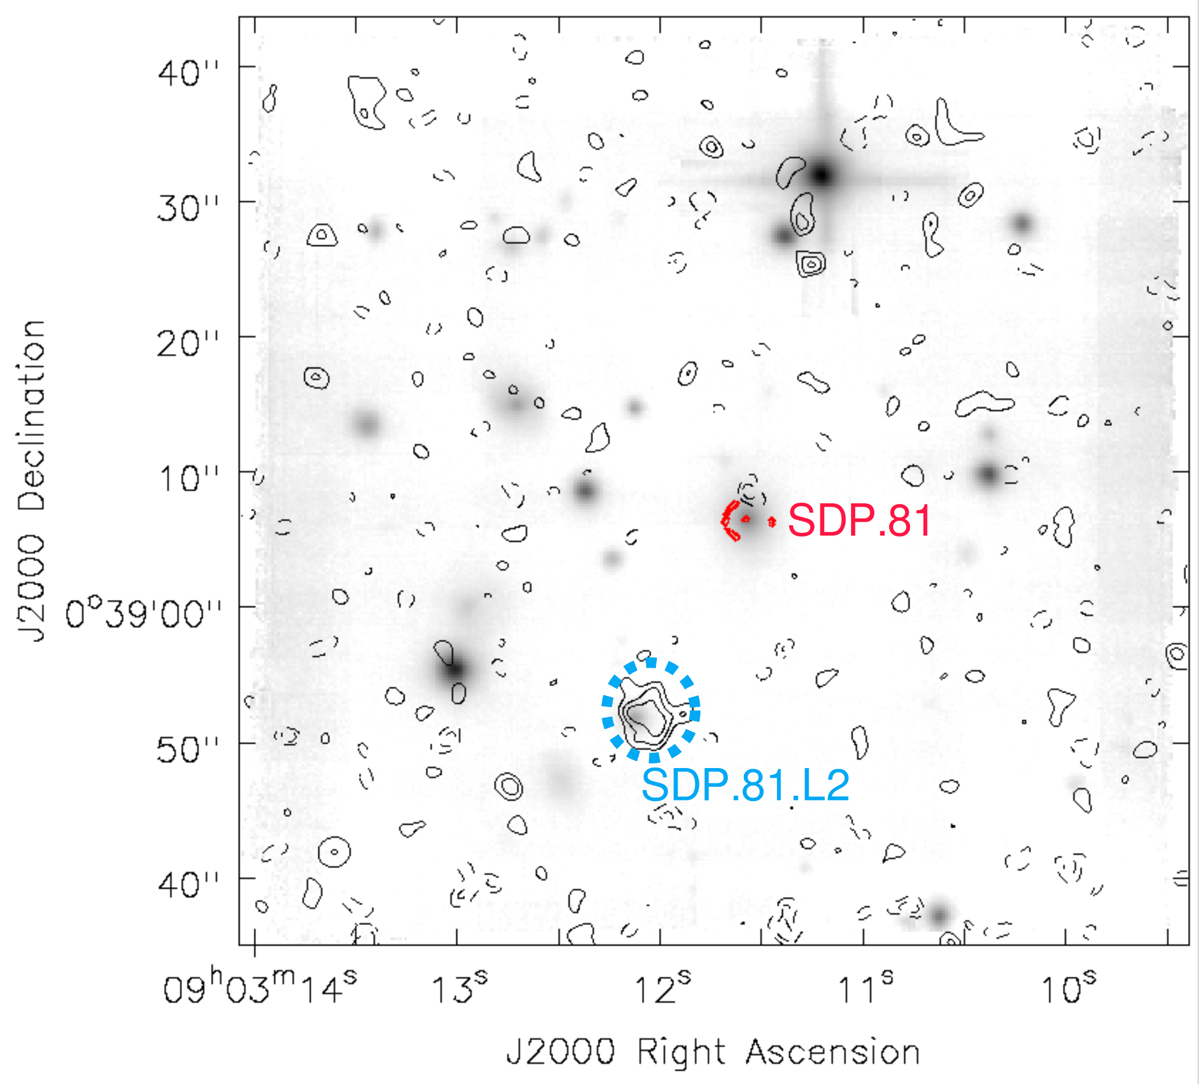
Fig. A.3.
Download original image
Overlay of the MUSE 465 - 930 nm continuum (greyscale), ALMA CO(1–0) emission (black contours, integrated over 88.55 - 88.65 GHz), and ALMA Band 3 continuum (red contours). The CO(1–0) contours start at 2σ and increase in steps of 1σ. The peak CO(1–0) S/N is 4.9σ. The CO(1–0) emission in the blue circle is co-spatial with an optically bright MUSE continuum source.
Current usage metrics show cumulative count of Article Views (full-text article views including HTML views, PDF and ePub downloads, according to the available data) and Abstracts Views on Vision4Press platform.
Data correspond to usage on the plateform after 2015. The current usage metrics is available 48-96 hours after online publication and is updated daily on week days.
Initial download of the metrics may take a while.