Open Access
Fig. 6.
Download original image
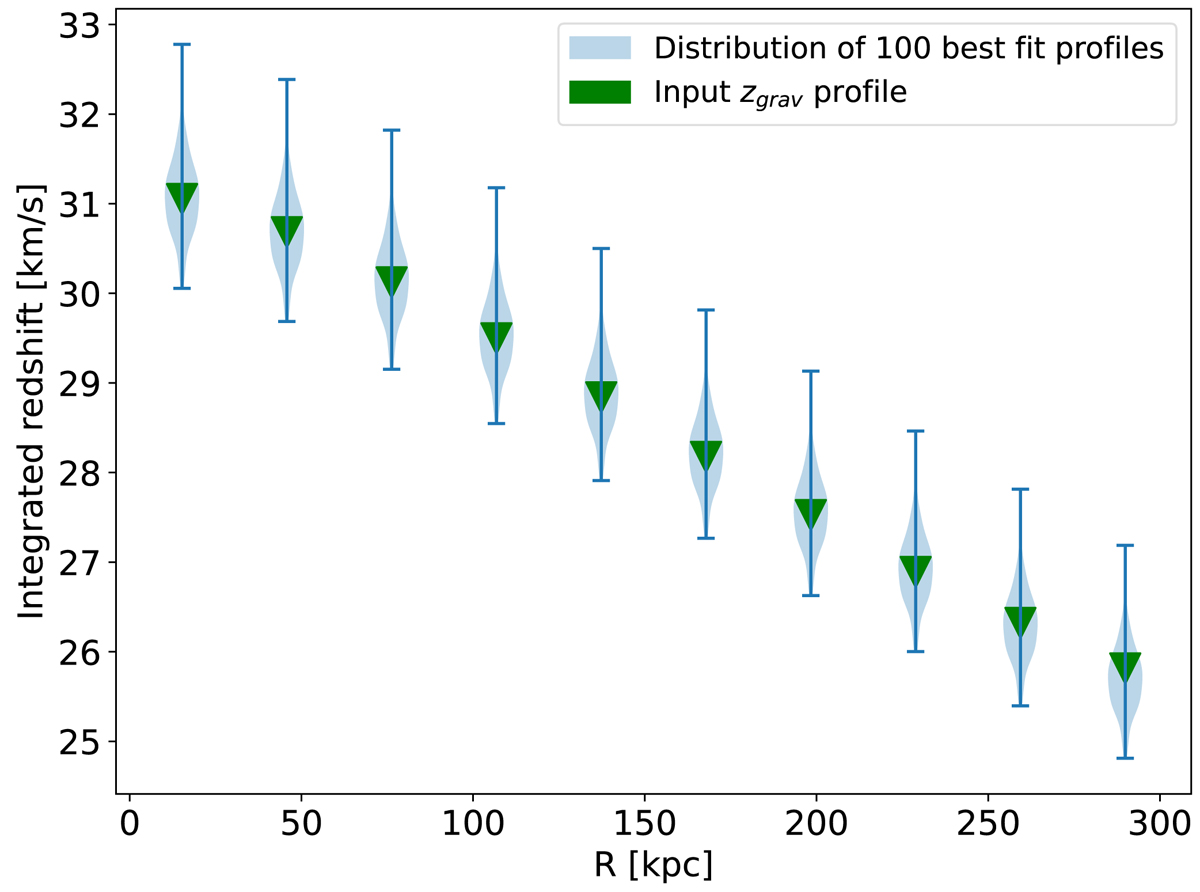
Distribution of the best fit profiles to 100 simulated reconstructed gravitational redshift profiles from X-IFU mock observations. The expected profile, that was used as an input in all the simulations, is plotted with the green triangles.
Current usage metrics show cumulative count of Article Views (full-text article views including HTML views, PDF and ePub downloads, according to the available data) and Abstracts Views on Vision4Press platform.
Data correspond to usage on the plateform after 2015. The current usage metrics is available 48-96 hours after online publication and is updated daily on week days.
Initial download of the metrics may take a while.