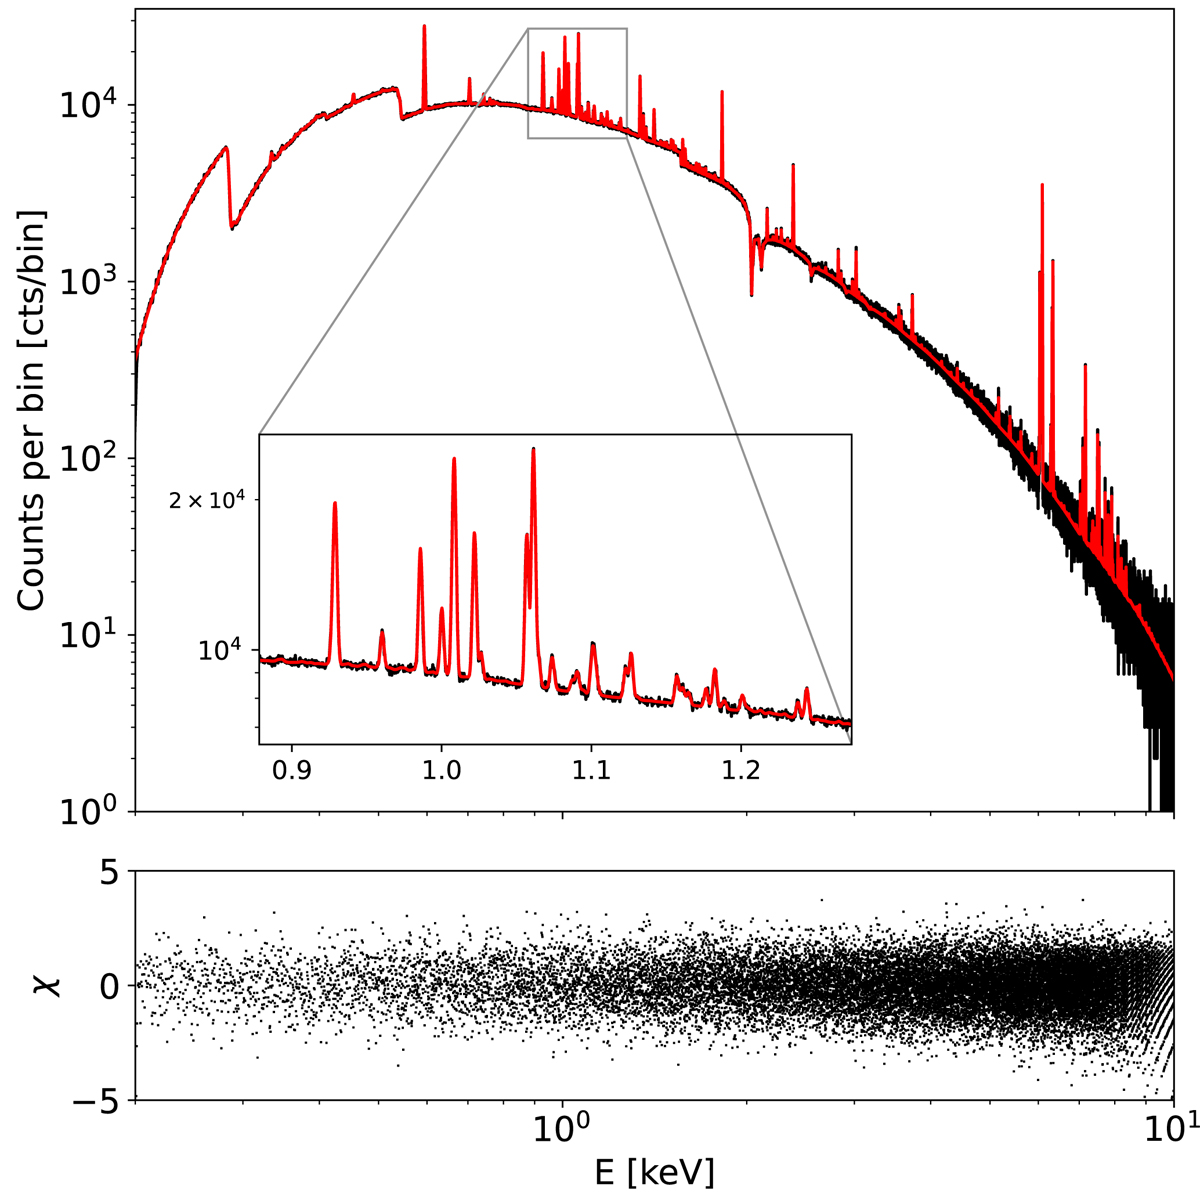
Fig. 4.
Download original image
Simulated spectrum from a 1Ms observation of the center of our cluster toy model (black line) and its best fit (red line). This spectrum is extracted from the central bin of the circular binning shown in the summary table in Fig. 1. An inset figure shows the details of the lines observed around 1 keV. The lower panel shows the error in units of χ for each bin. The quantized shape observed at the highest energies comes from the low number counts observed at these high energies.
Current usage metrics show cumulative count of Article Views (full-text article views including HTML views, PDF and ePub downloads, according to the available data) and Abstracts Views on Vision4Press platform.
Data correspond to usage on the plateform after 2015. The current usage metrics is available 48-96 hours after online publication and is updated daily on week days.
Initial download of the metrics may take a while.