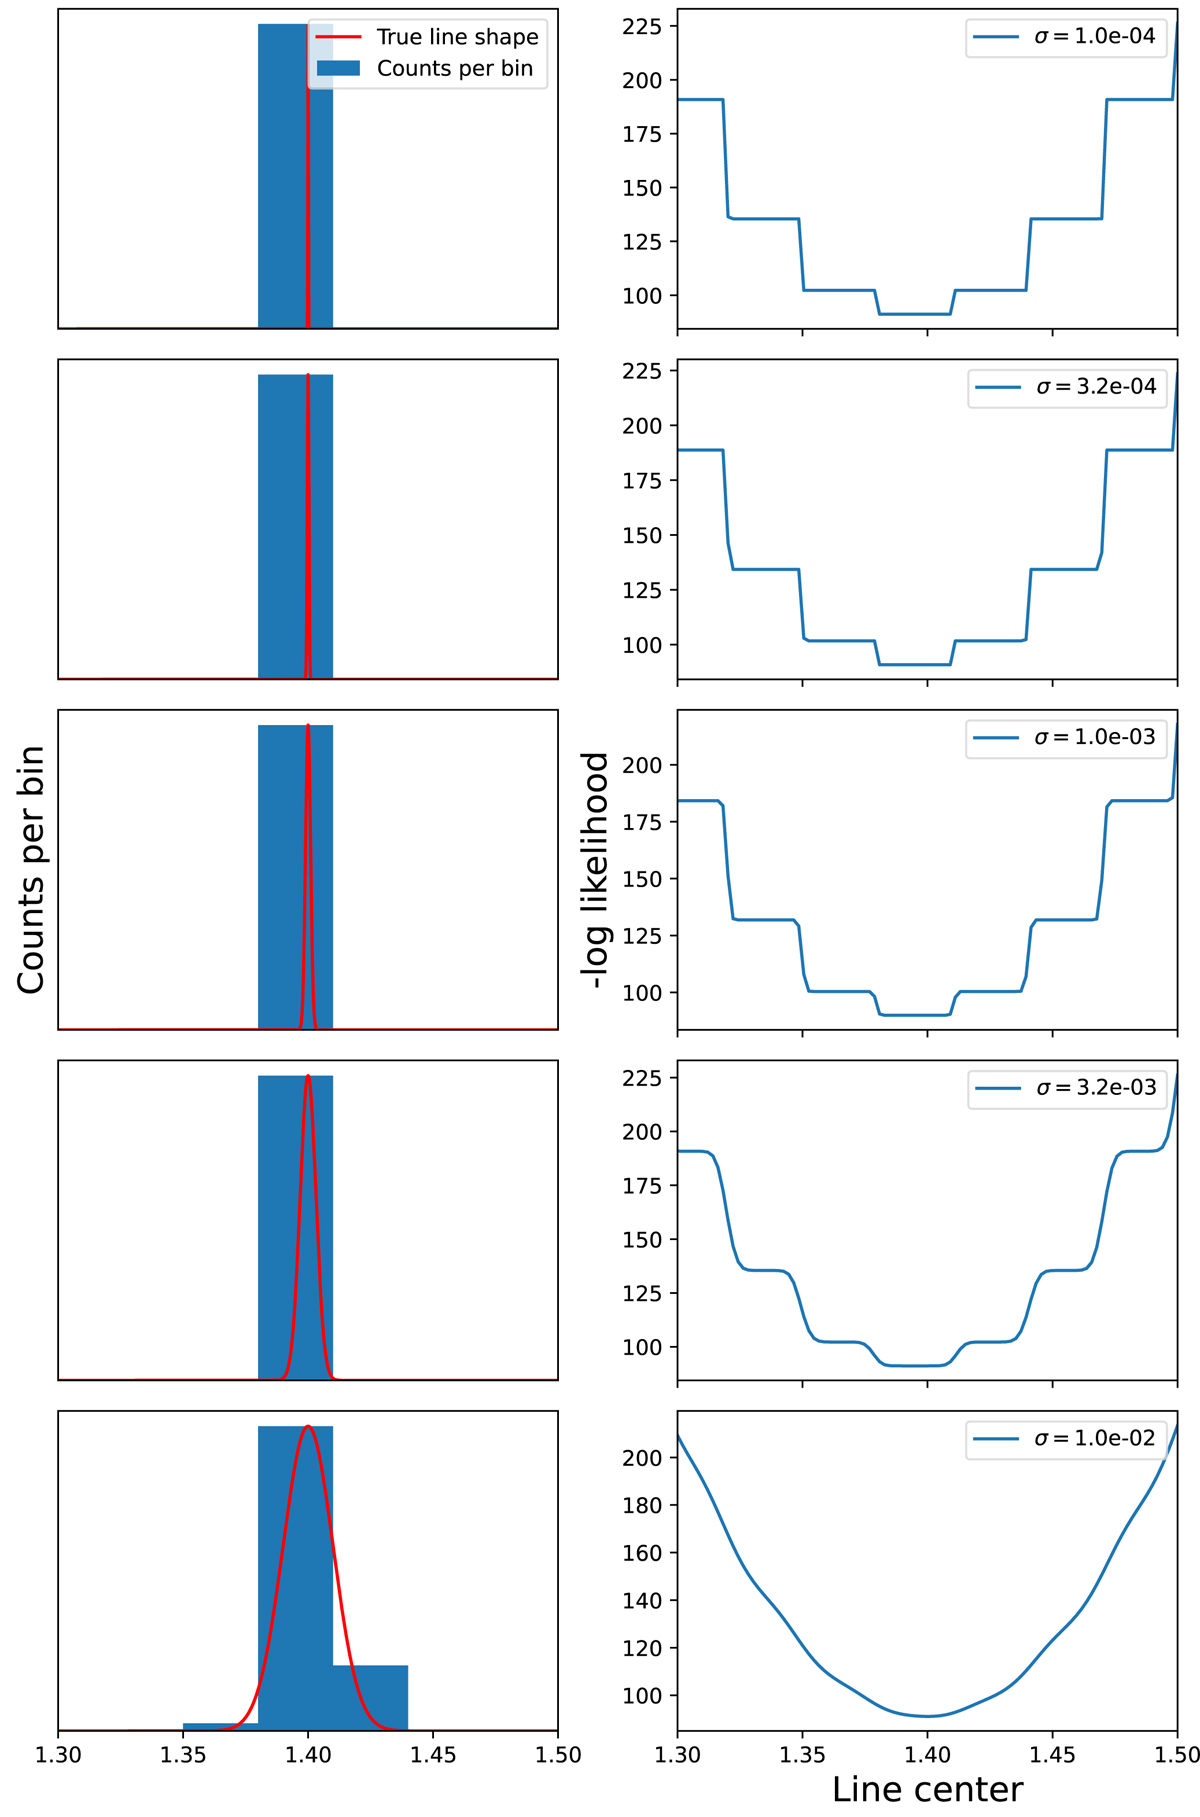
Fig. C.1.
Download original image
Illustration of the discretization occurring in the likelihood of a Gaussian model with respect to the line centroid when the line width is smaller than the binning of the data. Left: Counts per bin as well as true line shape, as a function of energy, in the instrument for lines of different shapes, before instrumental broadening. The qualitative purpose of this plot allows for the use of arbitrary units on the vertical axis. Right: Likelihood of the Gaussian line model with respect to the line center, associated to the line observed in the left panel.
Current usage metrics show cumulative count of Article Views (full-text article views including HTML views, PDF and ePub downloads, according to the available data) and Abstracts Views on Vision4Press platform.
Data correspond to usage on the plateform after 2015. The current usage metrics is available 48-96 hours after online publication and is updated daily on week days.
Initial download of the metrics may take a while.