Open Access
Fig. 1.
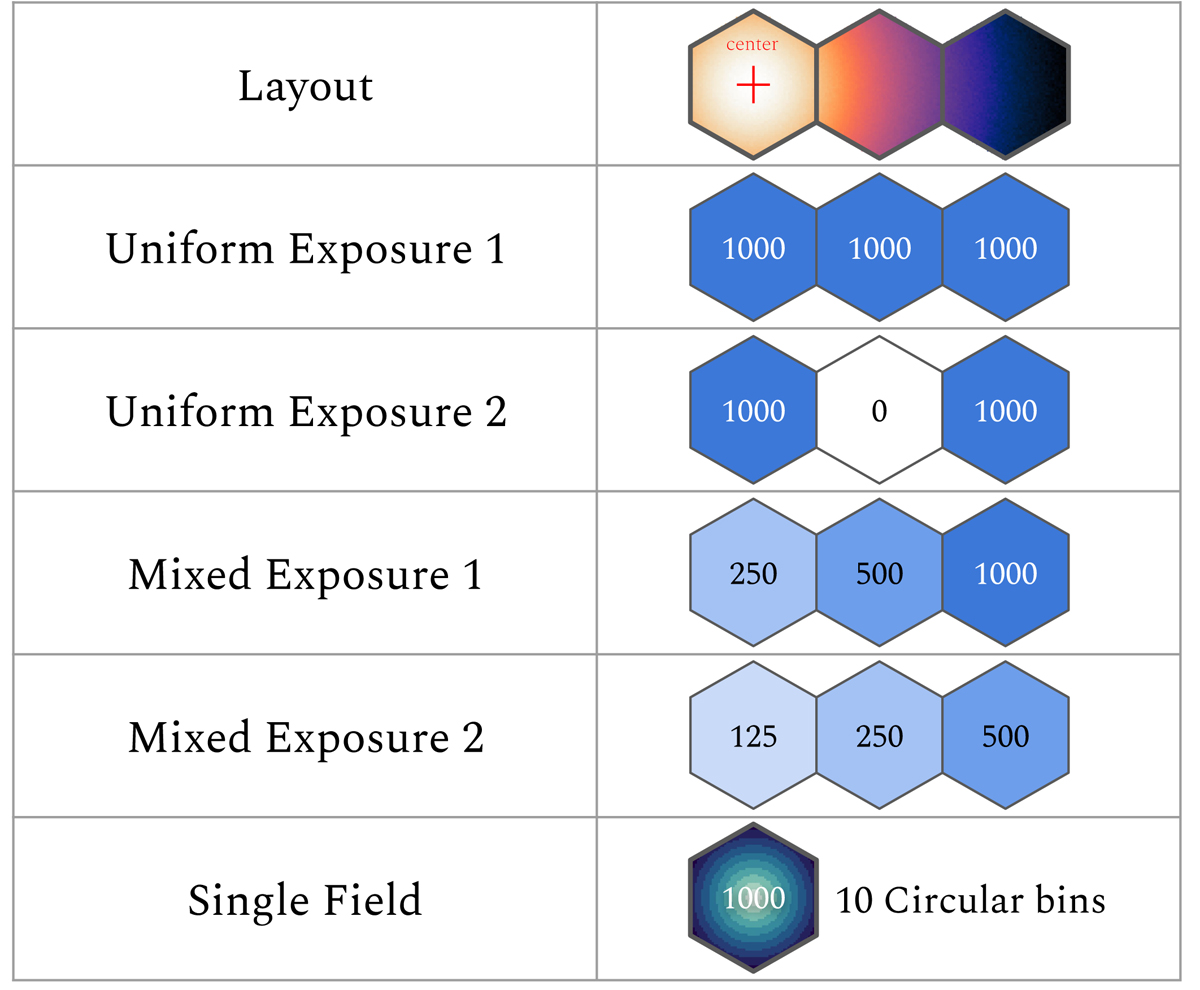
Download original image
Observing strategies considered in our simulations. The layout of the X-IFU pointings is shown in the right column together with the exposure time for each pointing in ks. The count map for the configuration “uniform exposure 1” is plotted in the first line and shows the cluster center.
Current usage metrics show cumulative count of Article Views (full-text article views including HTML views, PDF and ePub downloads, according to the available data) and Abstracts Views on Vision4Press platform.
Data correspond to usage on the plateform after 2015. The current usage metrics is available 48-96 hours after online publication and is updated daily on week days.
Initial download of the metrics may take a while.