Fig. A.8.
Download original image
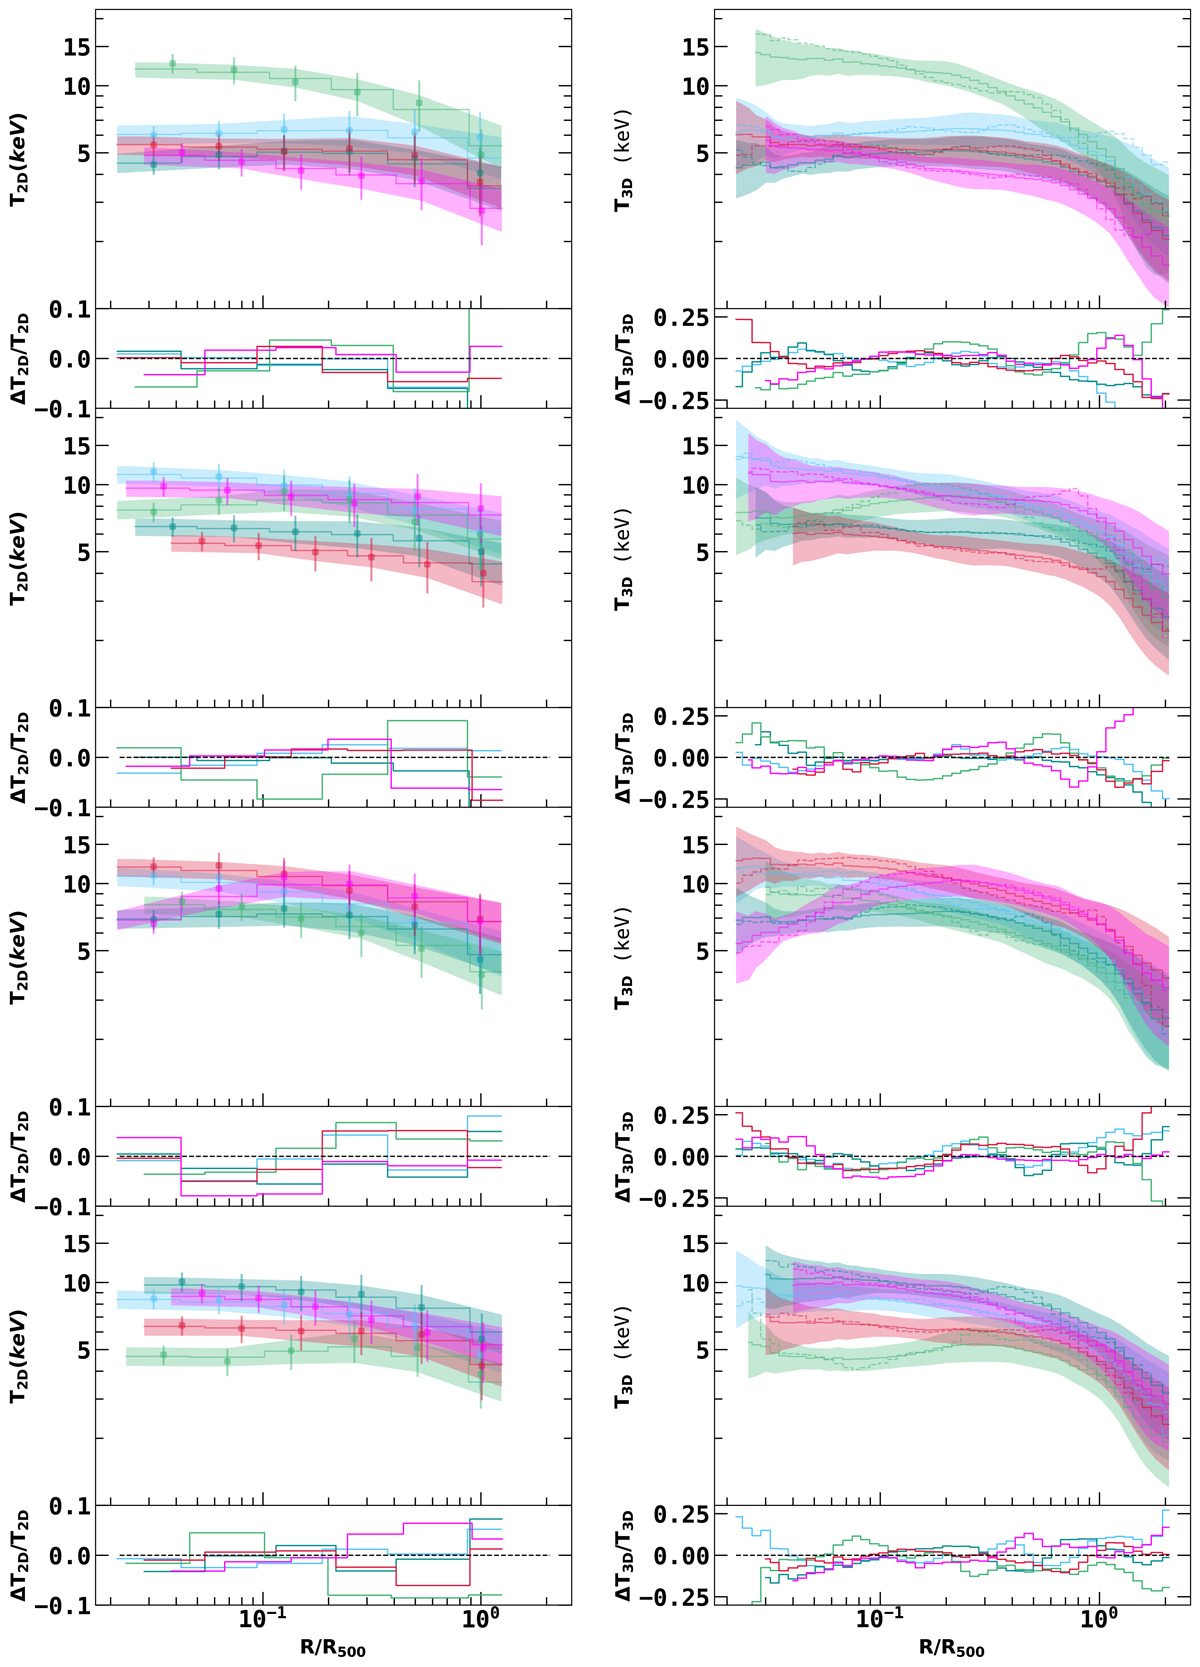
Left panel: Comparison of the 20 simulated 2D temperature profiles (solid points with errors) and reconstructed 2D temperature profiles obtained using IAE model (solid lines), the fitting being performed in the range [0.02-1] R500 considering six 2D temperature bins. The shaded regions represent the 1-σ dispersion of the reconstructed 2D temperature profiles. The smaller subplots show the residuals of the fit. Right panel: Solid lines and the shaded regions show the corresponding reconstructed 3D temperature profiles and the 1-σ dispersion respectively. Also shown in the dashed lines are the true 3D mass-weighted temperature profiles.
Current usage metrics show cumulative count of Article Views (full-text article views including HTML views, PDF and ePub downloads, according to the available data) and Abstracts Views on Vision4Press platform.
Data correspond to usage on the plateform after 2015. The current usage metrics is available 48-96 hours after online publication and is updated daily on week days.
Initial download of the metrics may take a while.