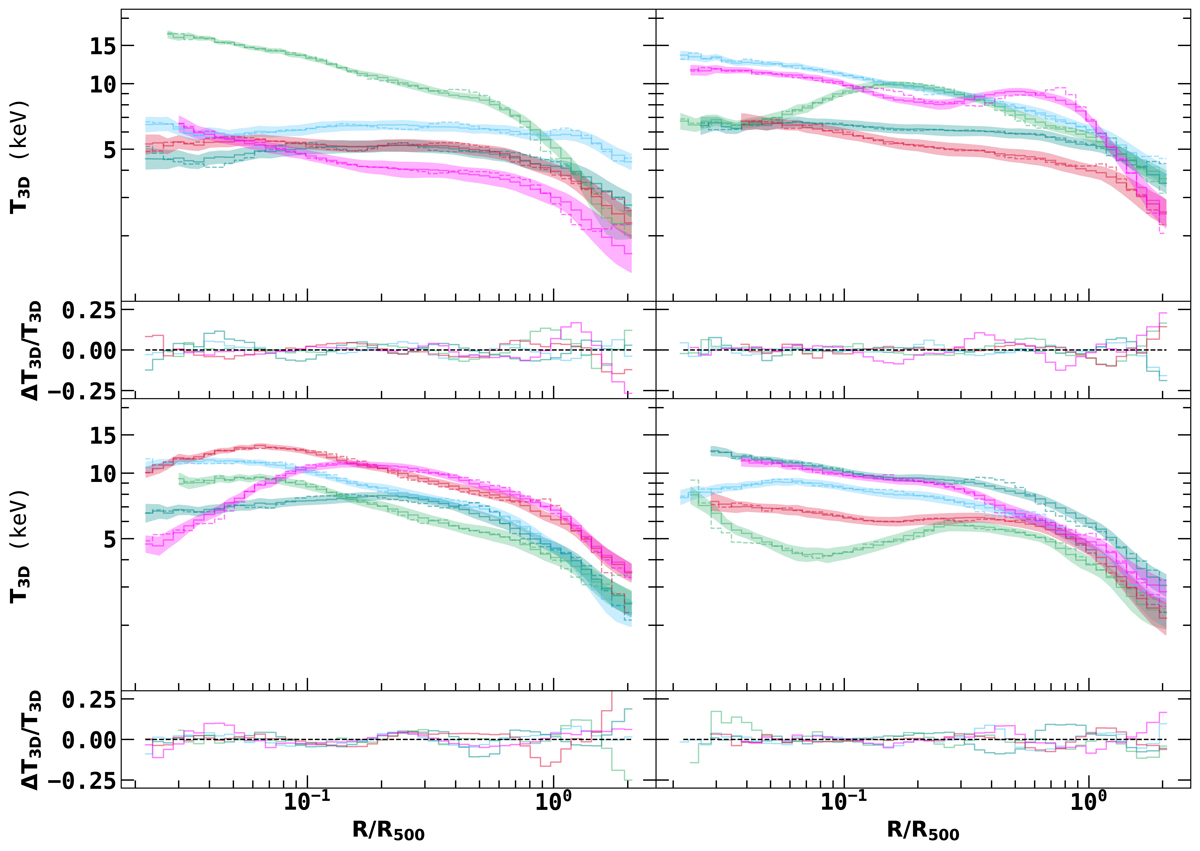
Fig. A.3.
Download original image
Comparison of the 20 3D mass-weighted temperature profiles in the validation sample (dashed lines) and reconstructed 3D median temperature profiles obtained from the IAE model (solid lines). The shaded regions represent the 1-σ dispersion (16th–84th percentile range) of the recovered profile. Also shown, in the smaller subplots, are the residuals of the fit.
Current usage metrics show cumulative count of Article Views (full-text article views including HTML views, PDF and ePub downloads, according to the available data) and Abstracts Views on Vision4Press platform.
Data correspond to usage on the plateform after 2015. The current usage metrics is available 48-96 hours after online publication and is updated daily on week days.
Initial download of the metrics may take a while.