Fig. 22.
Download original image
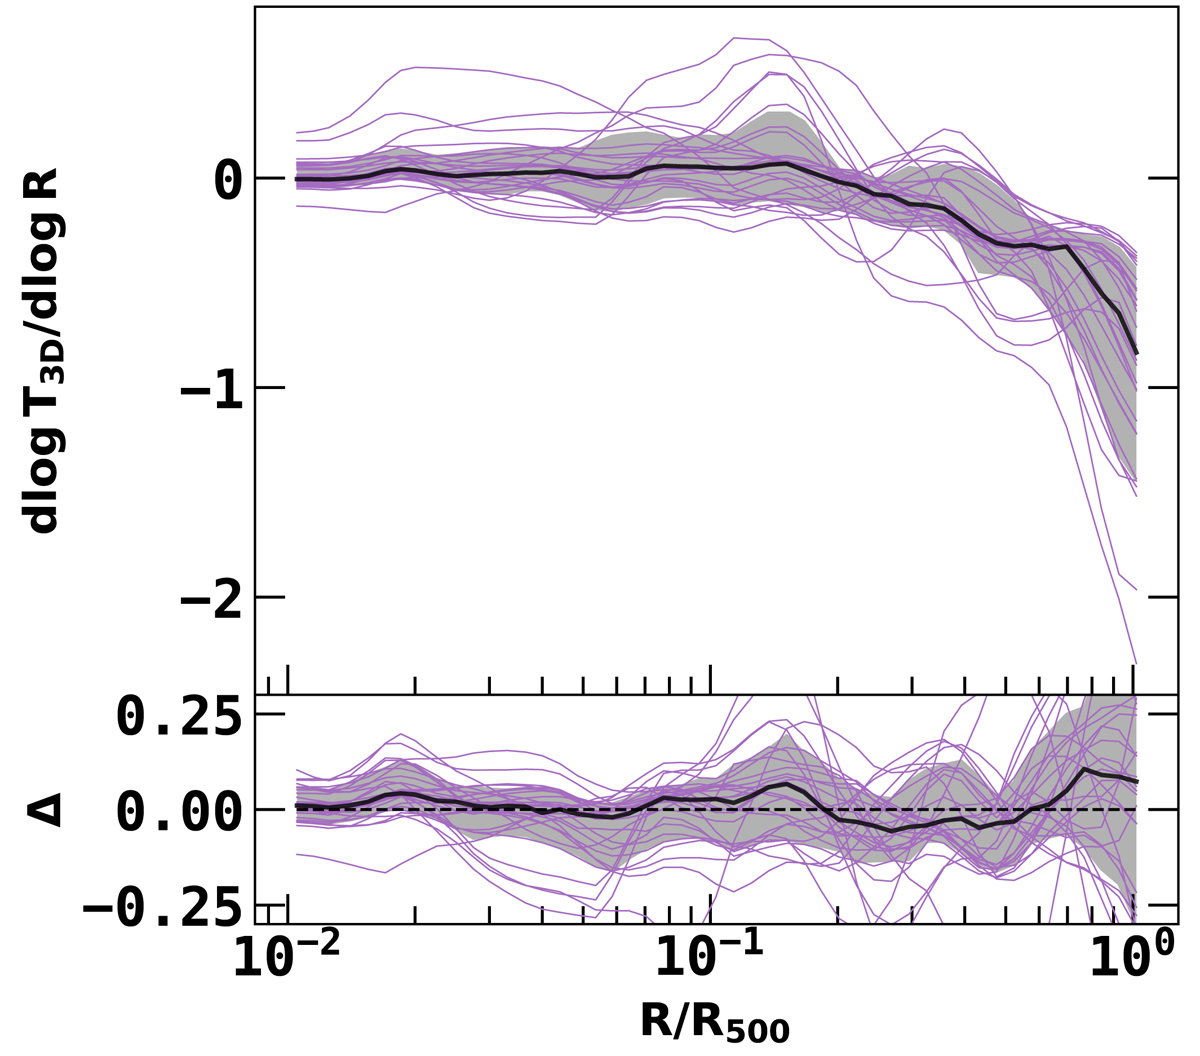
Logarithmic derivatives of 3D temperature profiles of the DR1 sample recovered with the IAE model. Also shown in the bottom panel is the difference between profiles recovered with the IAE model and the parametric model. For better visibility, the error bars corresponding to the individual profiles are not shown. The black lines and grey shaded grey regions represent the median and 1-σ dispersion of the sample.
Current usage metrics show cumulative count of Article Views (full-text article views including HTML views, PDF and ePub downloads, according to the available data) and Abstracts Views on Vision4Press platform.
Data correspond to usage on the plateform after 2015. The current usage metrics is available 48-96 hours after online publication and is updated daily on week days.
Initial download of the metrics may take a while.