Fig. 21.
Download original image
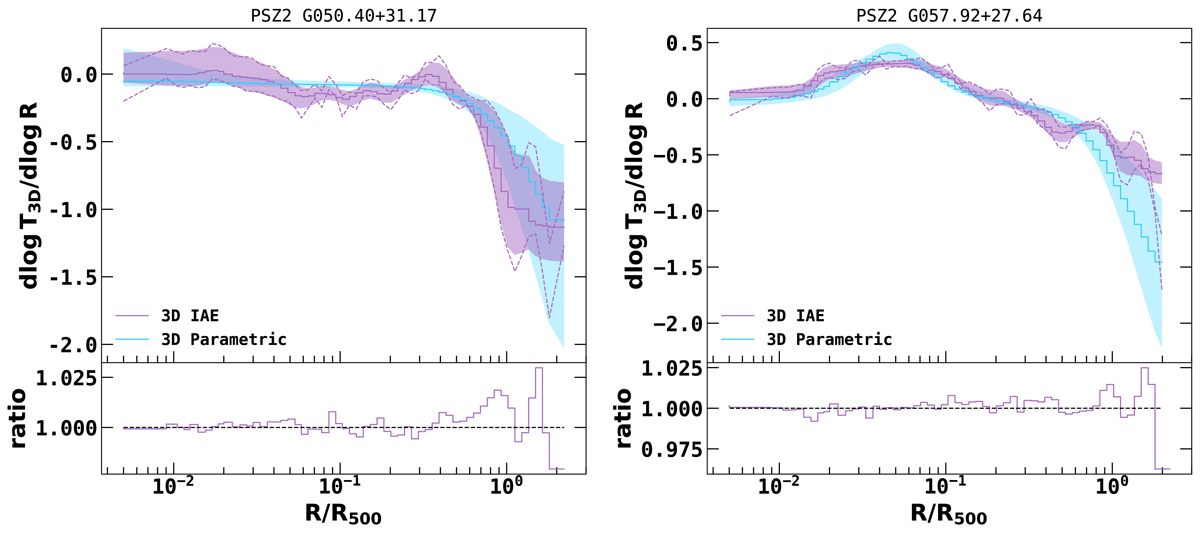
Comparison of the logarithmic derivatives 3D temperature profiles of a typical NCC (PSZ2 G050.40+31.17) and CC (PSZ2 G057.92+27.64) cluster in the DR1 sample recovered with the IAE and parametric models. Solid lines and the associated shaded regions show the median and 1-σ dispersion obtained with MCMC. The region enclosed by the dashed lines represents 1-σ dispersion, if no smoothing is applied to the profiles derived from the MCMC chain. The bottom panel shows the ratio of the median 3D temperature profiles obtained using IAE with and without smoothing.
Current usage metrics show cumulative count of Article Views (full-text article views including HTML views, PDF and ePub downloads, according to the available data) and Abstracts Views on Vision4Press platform.
Data correspond to usage on the plateform after 2015. The current usage metrics is available 48-96 hours after online publication and is updated daily on week days.
Initial download of the metrics may take a while.