Fig. 20.
Download original image
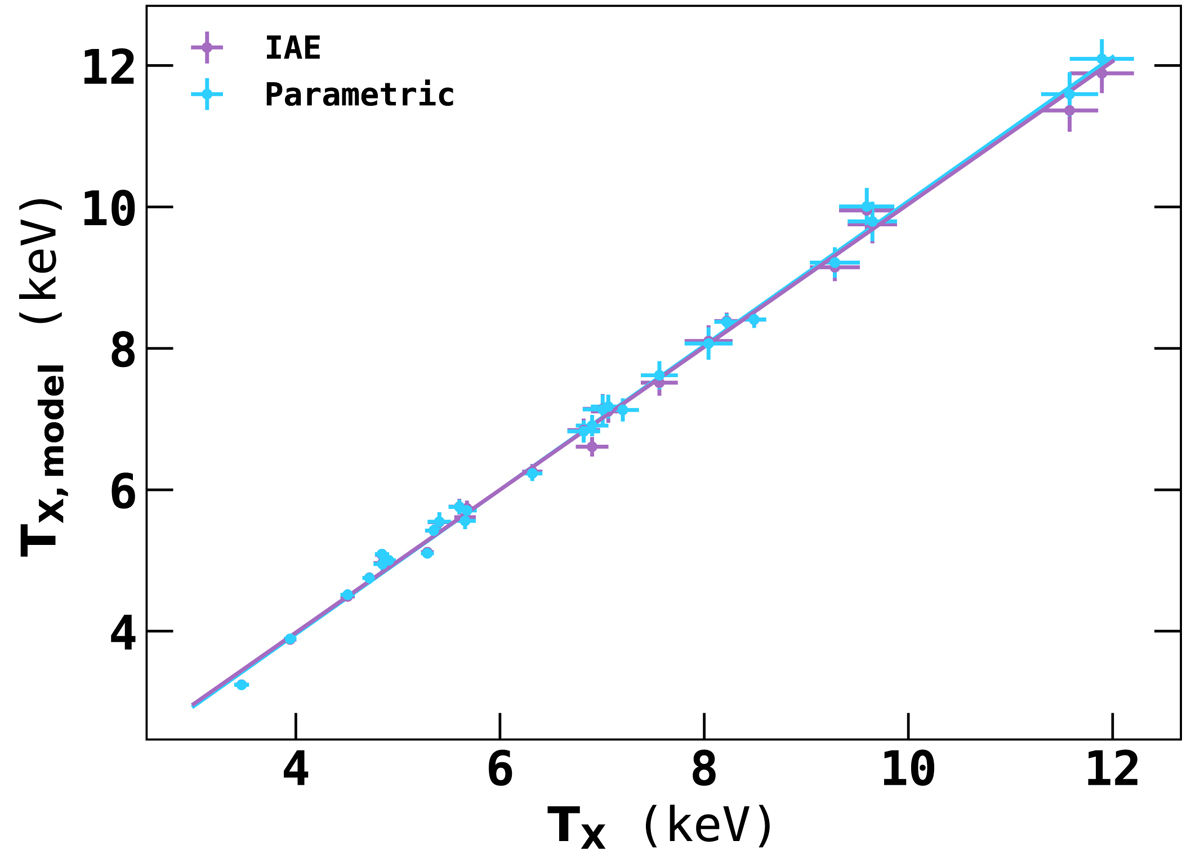
Left Panel: Comparison of the observed TX and the best-fit TX, model obtained with non-parametric IAE and parametric Vikhlinin et al. (2006) models. Solid lines show the best fit for the data. We see that both our non-parametric and parametric approaches provide tight and accurate constraints on the average temperature of clusters.
Current usage metrics show cumulative count of Article Views (full-text article views including HTML views, PDF and ePub downloads, according to the available data) and Abstracts Views on Vision4Press platform.
Data correspond to usage on the plateform after 2015. The current usage metrics is available 48-96 hours after online publication and is updated daily on week days.
Initial download of the metrics may take a while.