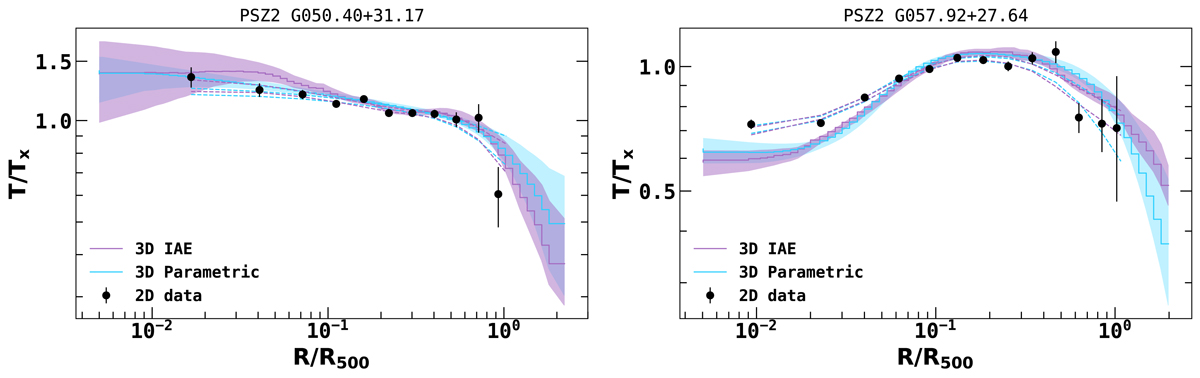
Fig. 18.
Download original image
Comparison of the scaled 2D and 3D temperature profiles of a typical NCC (PSZ2 G050.40+31.17) and CC (PSZ2 G057.92+27.64) cluster in the DR1 sample recovered with the IAE and parametric models. Solid lines and the associated shaded regions show the median and 1-σ dispersion of the reconstructed 3D temperature profile obtained with MCMC. Regions enclosed by the dashed lines represent the corresponding 1-σ dispersion 2D temperature profiles fitted to the observed 2D data (black dots). In line with our results with simulations for observational-like cases, we find that both the IAE model and parametric model with optimal priors generate comparable profiles for NCC and CC clusters.
Current usage metrics show cumulative count of Article Views (full-text article views including HTML views, PDF and ePub downloads, according to the available data) and Abstracts Views on Vision4Press platform.
Data correspond to usage on the plateform after 2015. The current usage metrics is available 48-96 hours after online publication and is updated daily on week days.
Initial download of the metrics may take a while.