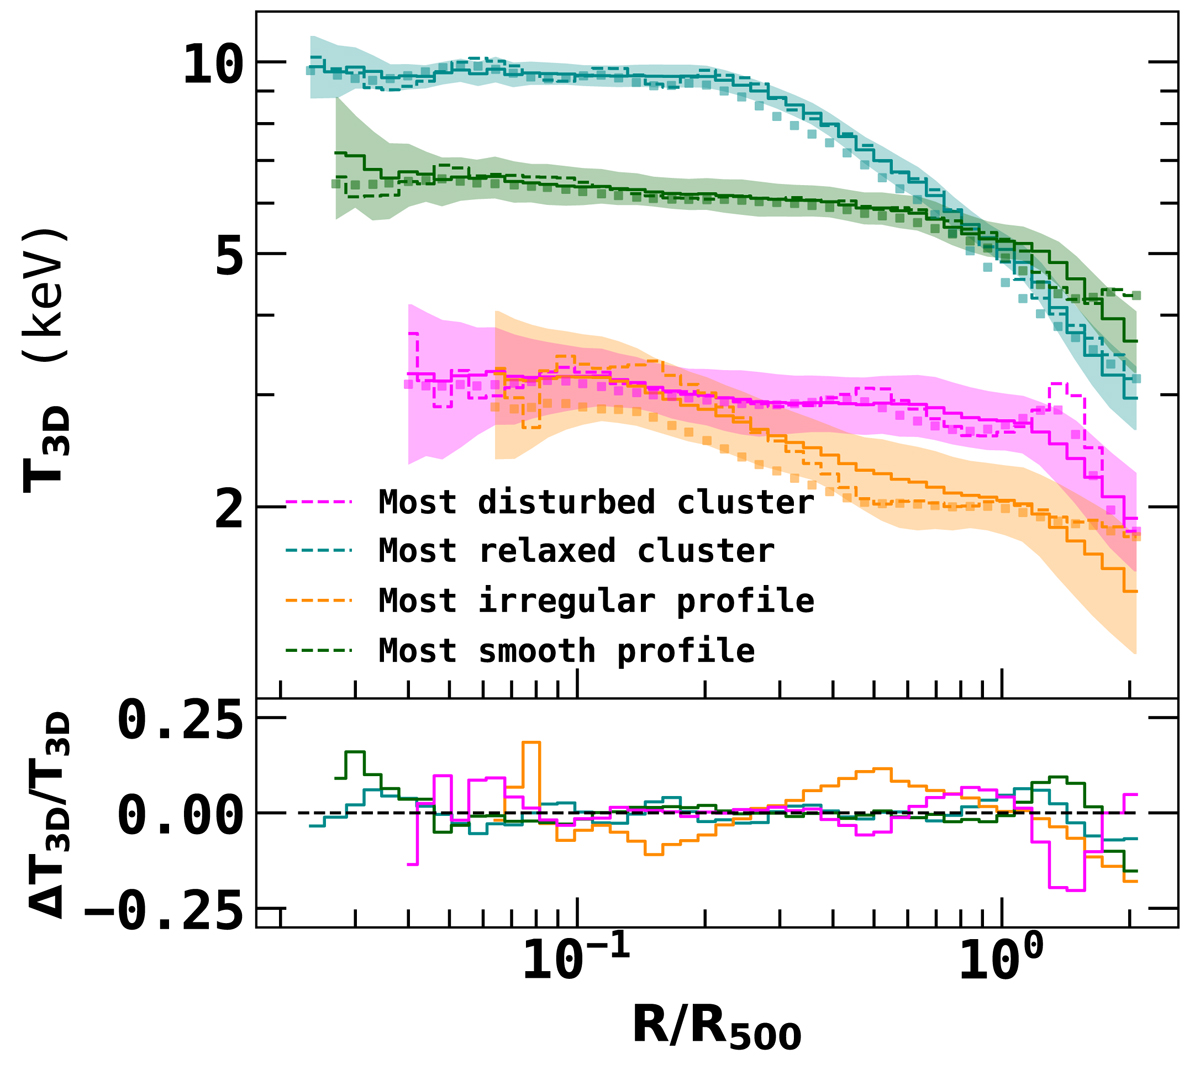
Fig. 11.
Download original image
Results for the most relaxed/disturbed clusters and for the most smooth/irregular profiles with IAE for the 2D–3D fit (fine binning). Left panel: Dashed cyan and magenta lines show the true 3D temperature profiles of the most relaxed and disturbed clusters in the validation sample, respectively. Dashed green and orange lines show the most smooth and irregular true 3D temperature profiles, respectively. The solid lines and the corresponding shaded regions show the median and 1-σ dispersion of the reconstructed temperature profile obtained from the IAE model using MCMC. The dotted lines show the 2D temperature profiles actually used in the fitting.
Current usage metrics show cumulative count of Article Views (full-text article views including HTML views, PDF and ePub downloads, according to the available data) and Abstracts Views on Vision4Press platform.
Data correspond to usage on the plateform after 2015. The current usage metrics is available 48-96 hours after online publication and is updated daily on week days.
Initial download of the metrics may take a while.