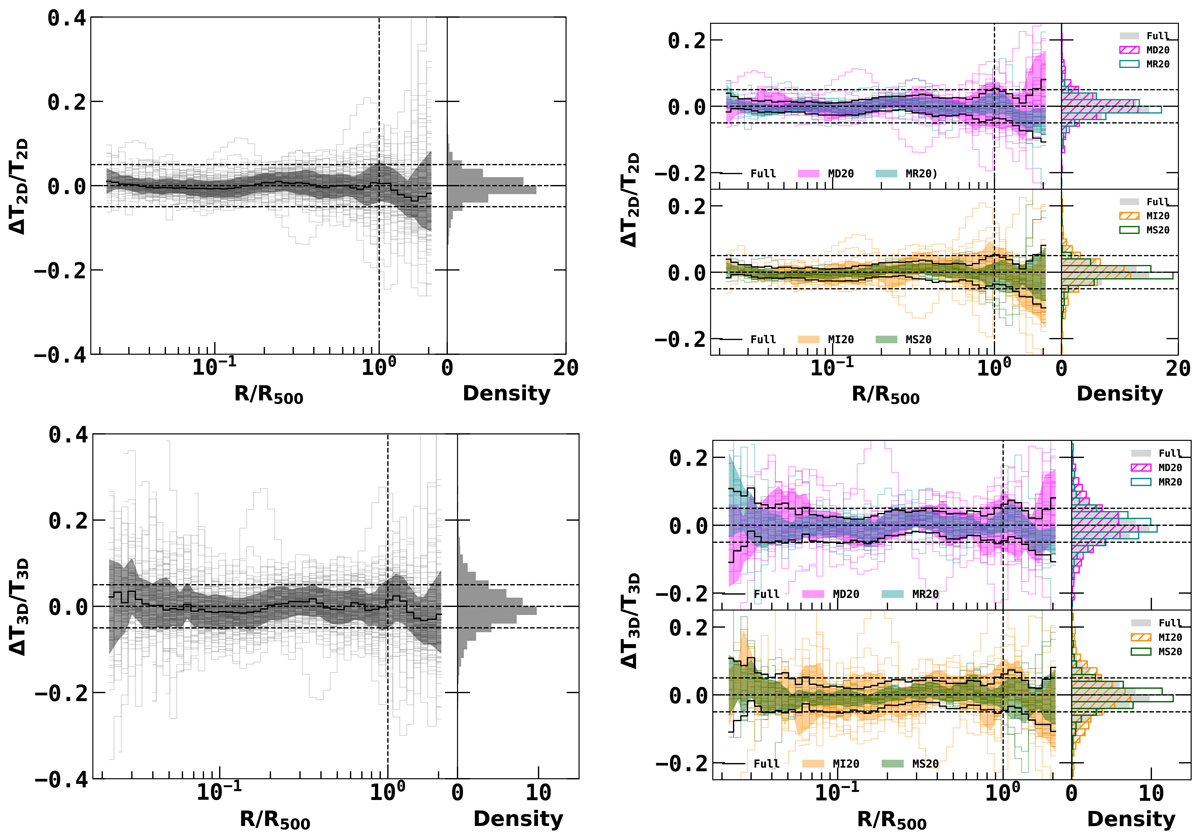
Fig. 10.
Download original image
Fractional 2D and 3D residuals for 115 clusters in the validation sample with IAE for the 2D–3D fit (fine binning). The three horizontal dashed black lines represent zero and ±5% fractional residuals; the vertical dashed black lines represent R500. Left panel: Grey lines show the individual 2D (top panel) and 3D (bottom panel) residuals of all the clusters. The solid black line and shaded black region in the left panels show the median and 1-σ dispersion of the 2D (top panel) and 3D (bottom panel) residual distribution, respectively. The histogram shows the distribution of residuals over all radii. Right panel: The cyan and magenta lines show the 2D (top panel) and 3D (bottom panel) residuals of the MR20 and MD20 sub-samples respectively. Green and orange lines show the 2D (top panel) and 3D (bottom panel) residuals of the MS20 and MI20 sub-samples respectively. Shaded regions show the corresponding 1-σ dispersion of the residual distribution. Regions enclosed by the solid black lines show the 1-σ dispersion of the median residual of the full validation sample. The histograms show the distribution of residuals over all radii. When given 2D profiles as input, the IAE model can reconstruct 3D temperature profiles with a fractional difference of about 5% across nearly the full radial range.
Current usage metrics show cumulative count of Article Views (full-text article views including HTML views, PDF and ePub downloads, according to the available data) and Abstracts Views on Vision4Press platform.
Data correspond to usage on the plateform after 2015. The current usage metrics is available 48-96 hours after online publication and is updated daily on week days.
Initial download of the metrics may take a while.