Fig. 1.
Download original image
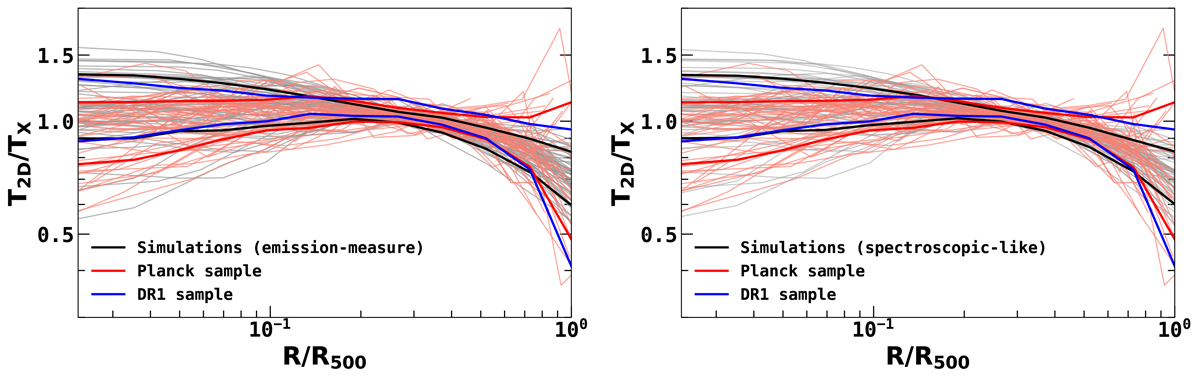
Comparison of the observed 2D temperature profiles, scaled as a function of R500 and TX, the temperature in the [0.15–0.75] R500 region. The thin grey lines show 50 randomly selected simulated 2D temperature profiles from the THREE HUNDRED PROJECT, extracted with an observation-like annular binning resolution, derived using emission measure (left panel) and spectroscopic-like (right panel) weighting schemes. The thin red lines show individual profiles in the Planck Collaboration XI (2011) sample. For better visibility, the error bars corresponding to the observed profiles are not shown. The regions enclosing thick black and red lines show the 1-σ dispersion (16th–84th percentile range) of the temperature profiles of the full simulated sample and the Planck sample respectively. The regions enclosing the thick blue lines show the 1-σ dispersion of the CHEX-MATE DR1 sample. Scaled by R500 and TX, both the emission measure and spectroscopic-like derived 2D simulated temperature profiles become somewhat self-similar.
Current usage metrics show cumulative count of Article Views (full-text article views including HTML views, PDF and ePub downloads, according to the available data) and Abstracts Views on Vision4Press platform.
Data correspond to usage on the plateform after 2015. The current usage metrics is available 48-96 hours after online publication and is updated daily on week days.
Initial download of the metrics may take a while.