Fig. D.1.
Download original image
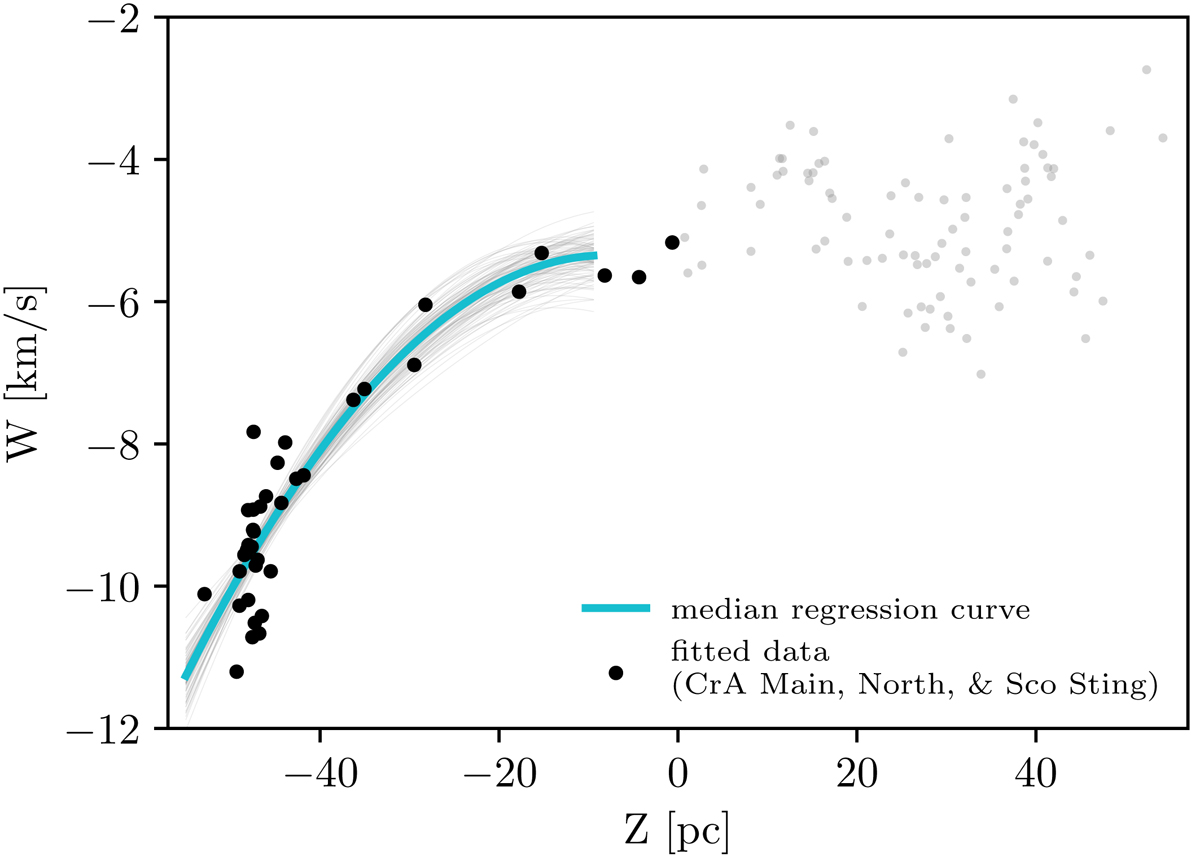
Bayesian quadratic fit to the stars of the clusters CrA Main, North, and Sco Sting, shown as black dots. The regression curve with the median of all sampled parameters is plotted as a solid cyan line, a 100 random fitted curves are shown as light gray lines. The Bayesian model comparison significantly prefers the quadratic over a linear fit.
Current usage metrics show cumulative count of Article Views (full-text article views including HTML views, PDF and ePub downloads, according to the available data) and Abstracts Views on Vision4Press platform.
Data correspond to usage on the plateform after 2015. The current usage metrics is available 48-96 hours after online publication and is updated daily on week days.
Initial download of the metrics may take a while.