Fig. 1.
Download original image
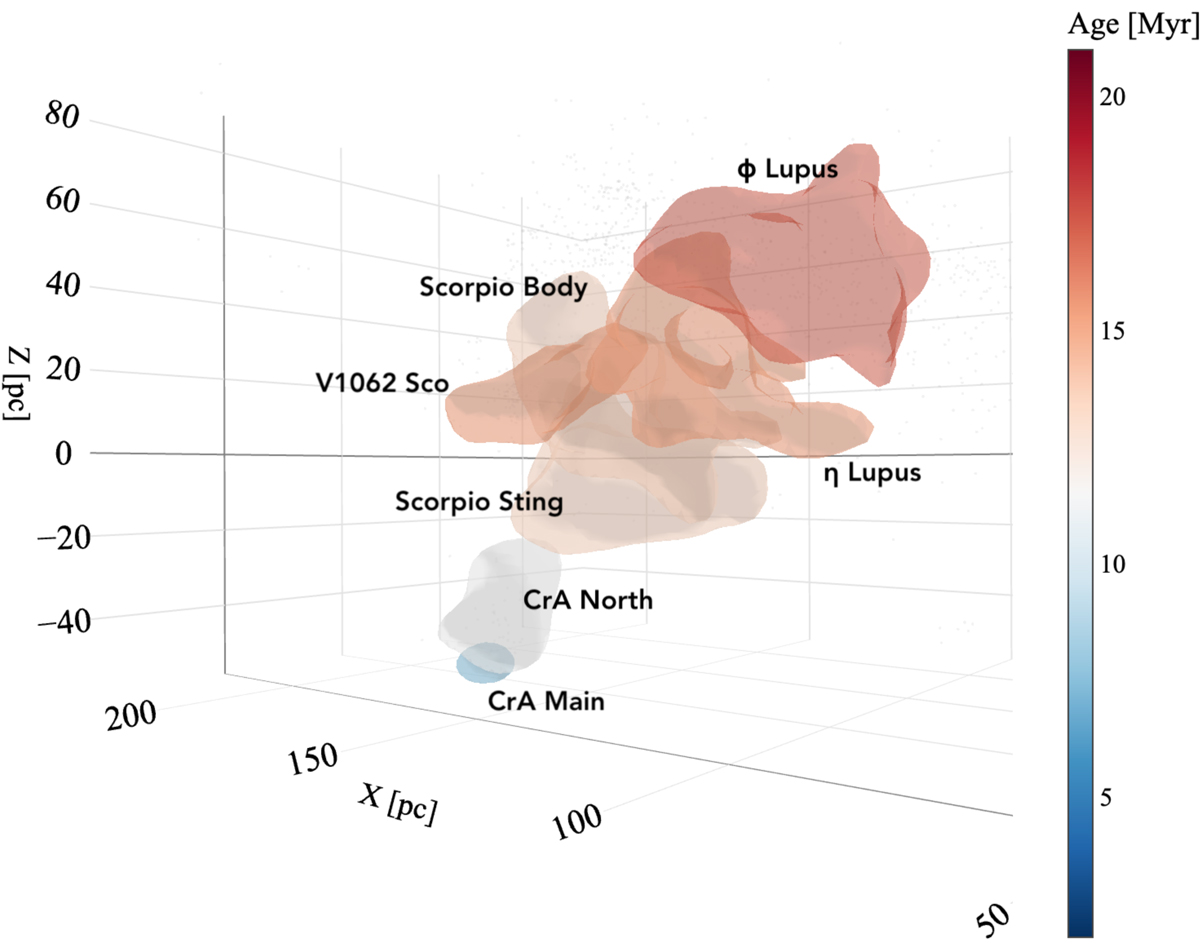
Volume plot of the 3D spatial distribution of the CrA chain of clusters as identified by R23b. An interactive 3D version of the figure is available online. The clusters are color-coded by age. From bottom left to top right and youngest to oldest, they are CrA Main, CrA North, Sco Sting, Sco Body, V1062 Sco, η Lupus, and ϕ Lupus.
Current usage metrics show cumulative count of Article Views (full-text article views including HTML views, PDF and ePub downloads, according to the available data) and Abstracts Views on Vision4Press platform.
Data correspond to usage on the plateform after 2015. The current usage metrics is available 48-96 hours after online publication and is updated daily on week days.
Initial download of the metrics may take a while.