Open Access
Fig. A.1
Download original image
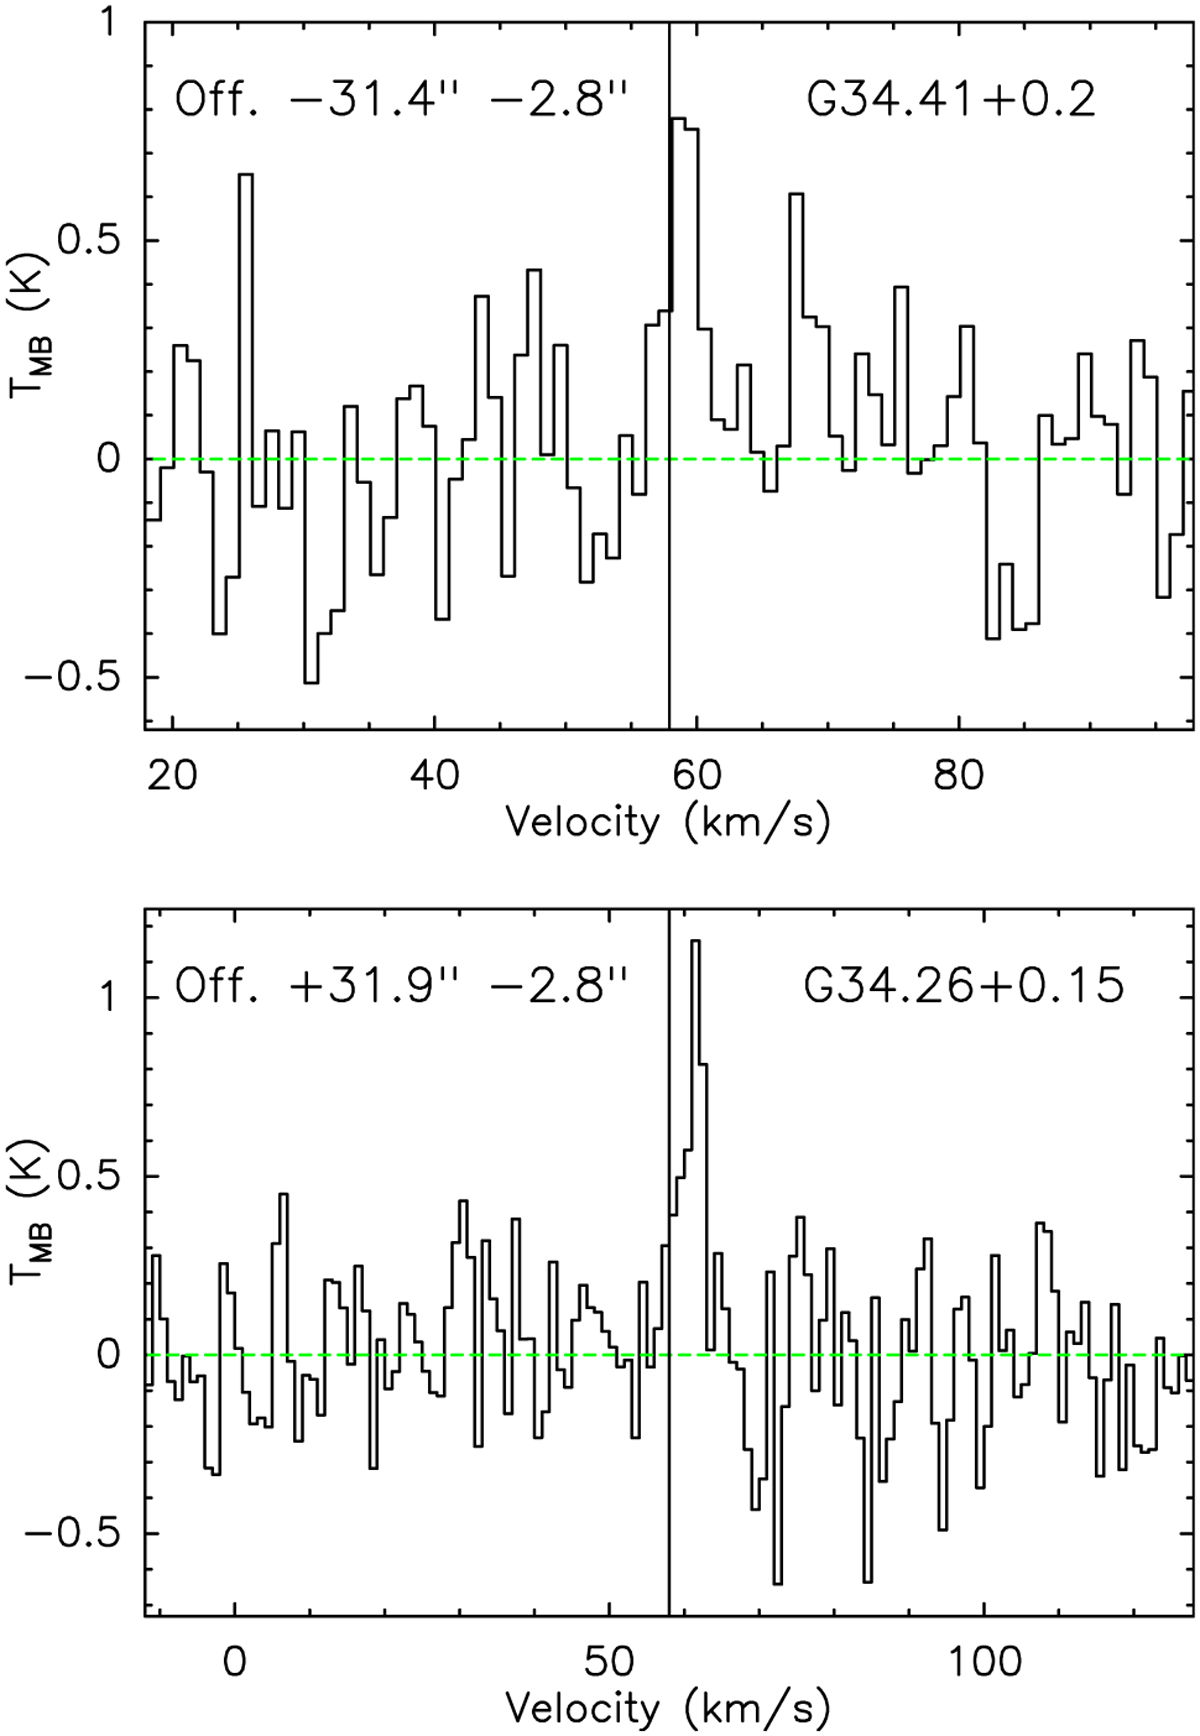
Spectra of the CO 16−15 emission arising from extended positions away from source centres. The offsets in right ascension and declination are shown in each spectrum. Black vertical lines mark the position of V1sr. Baselines are shown with green horizontal lines. The spectra were smoothed to 1.0 km s−1.
Current usage metrics show cumulative count of Article Views (full-text article views including HTML views, PDF and ePub downloads, according to the available data) and Abstracts Views on Vision4Press platform.
Data correspond to usage on the plateform after 2015. The current usage metrics is available 48-96 hours after online publication and is updated daily on week days.
Initial download of the metrics may take a while.