Fig. 8
Download original image
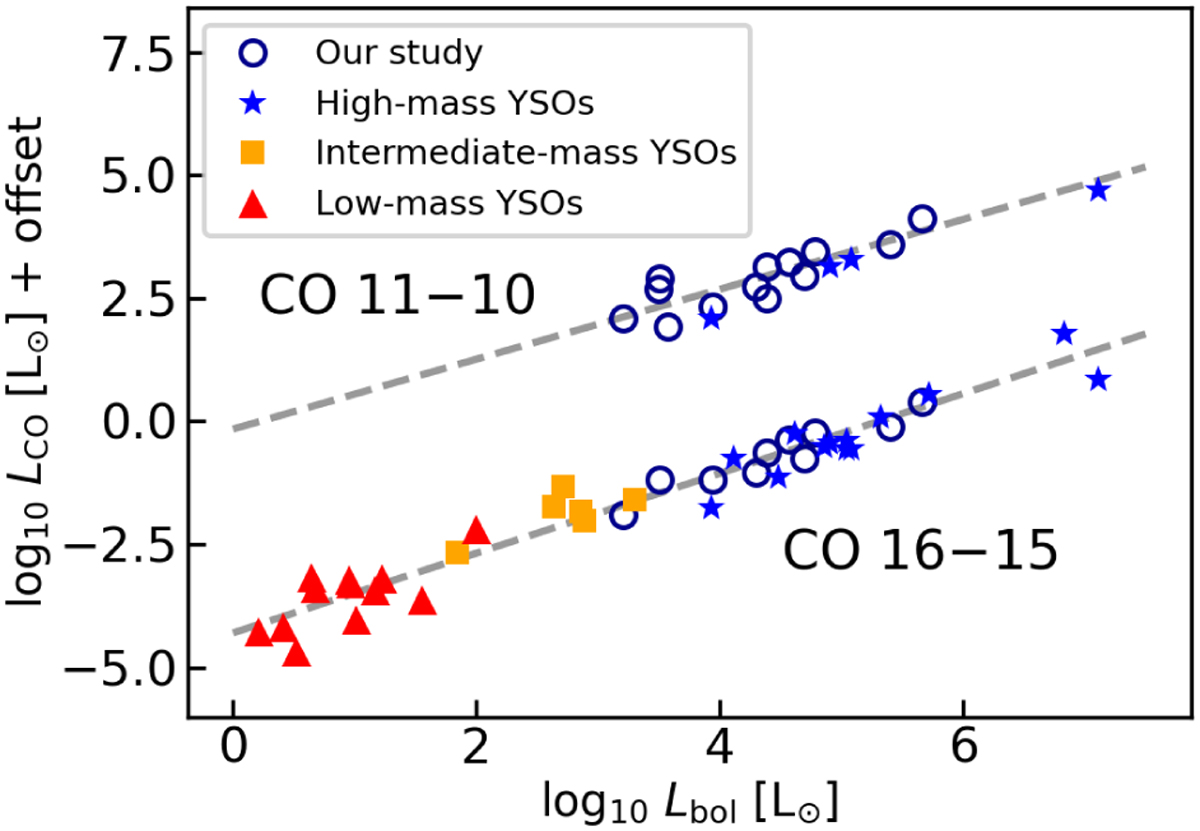
Velocity-integrated CO line luminosity of 11−10 and 16−15 transitions versus source bolometric luminosity from low- to high-mass star-forming regions. The dashed lines show a linear fit obtained using only the sources from our study, which are shown in blue empty circles. Blue stars show observations of other high-mass protostars from Karska et al. (2014), Indriolo et al. (2017), and Kaźmierczak-Barthel et al. (2014); orange squares present emission from intermediate-mass objects (Matuszak et al. 2015); and red triangles show data for Class 0 protostars (Kristensen et al. 2017).
Current usage metrics show cumulative count of Article Views (full-text article views including HTML views, PDF and ePub downloads, according to the available data) and Abstracts Views on Vision4Press platform.
Data correspond to usage on the plateform after 2015. The current usage metrics is available 48-96 hours after online publication and is updated daily on week days.
Initial download of the metrics may take a while.