Fig. 6
Download original image
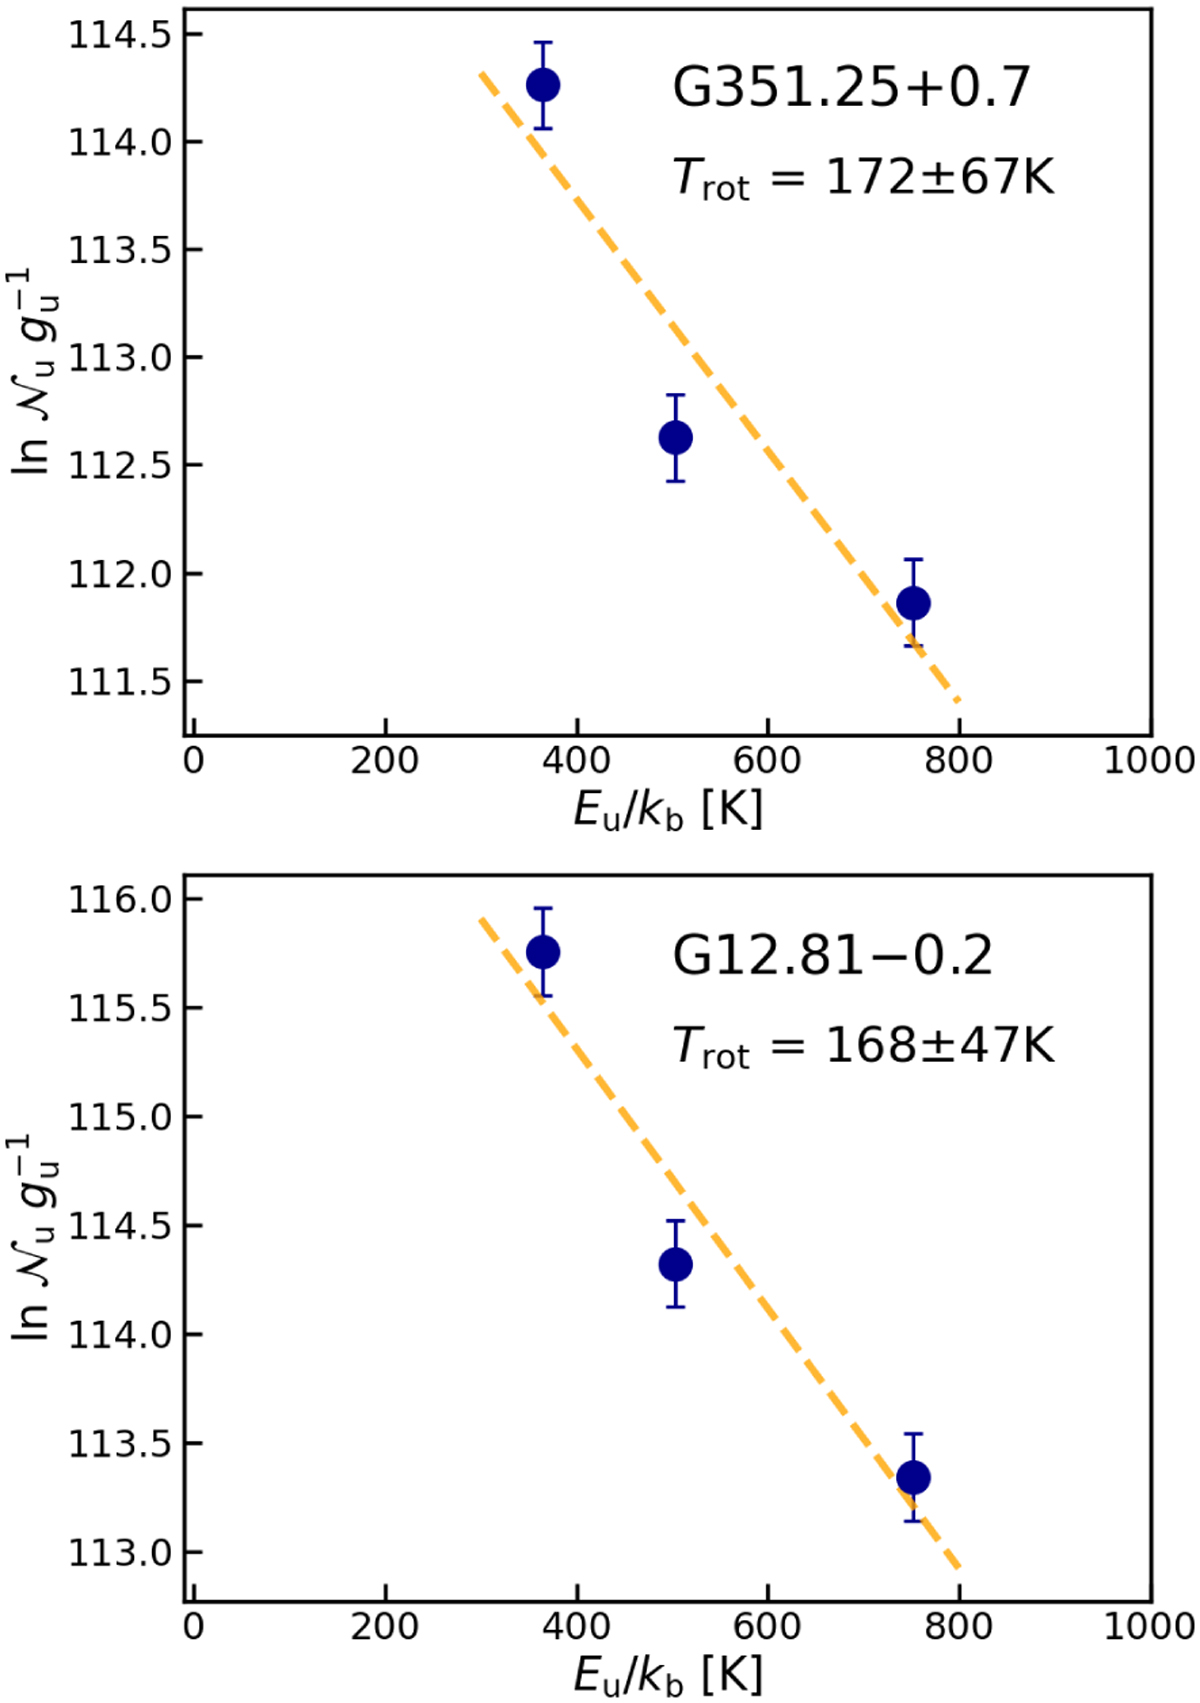
Rotational diagrams of CO for G12.81−0.2 and G351.25+0.7, which are based on the observations of full profile CO transitions with Ju of 11, 13, and 16. The natural logarithm of the number of emitting molecules from a level u, 𝒩u (dimensionless), divided by the degeneracy of the level, gu, is shown as a function of the upper level energy, Eu /kB, in Kelvins. Detections are shown as blue circles. Dashed orange lines show linear regression fits to the data; the resulting rotational temperatures are provided in the plots with the associated errors from the fit.
Current usage metrics show cumulative count of Article Views (full-text article views including HTML views, PDF and ePub downloads, according to the available data) and Abstracts Views on Vision4Press platform.
Data correspond to usage on the plateform after 2015. The current usage metrics is available 48-96 hours after online publication and is updated daily on week days.
Initial download of the metrics may take a while.