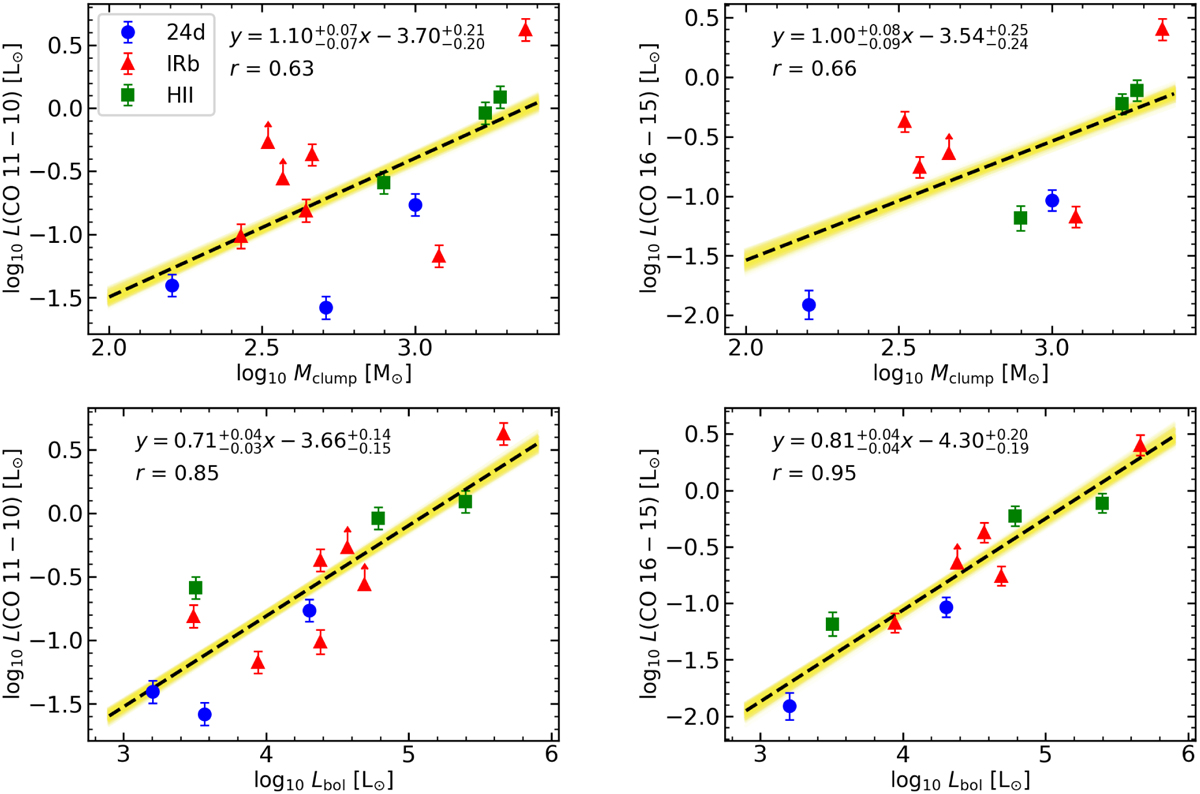
Fig. 3
Download original image
Line luminosities of CO 11−10 and 16−15, as a function of Mclump and Lbol IR-weak (24d) sources are shown with blue circles, IR-bright (IRb) sources with red triangles, and HII regions (HII) with green squares. The linear regression fit with Markov chain Monte Carlo is shown with dashed black lines and yellow shades. The linear log-log and Pearson correlation coefficients, r, are presented in each plot. Objects with self-absorption are shown with an upward arrow, indicating the lower limit for calculated luminosities.
Current usage metrics show cumulative count of Article Views (full-text article views including HTML views, PDF and ePub downloads, according to the available data) and Abstracts Views on Vision4Press platform.
Data correspond to usage on the plateform after 2015. The current usage metrics is available 48-96 hours after online publication and is updated daily on week days.
Initial download of the metrics may take a while.