Open Access
Fig. D.4
Download original image
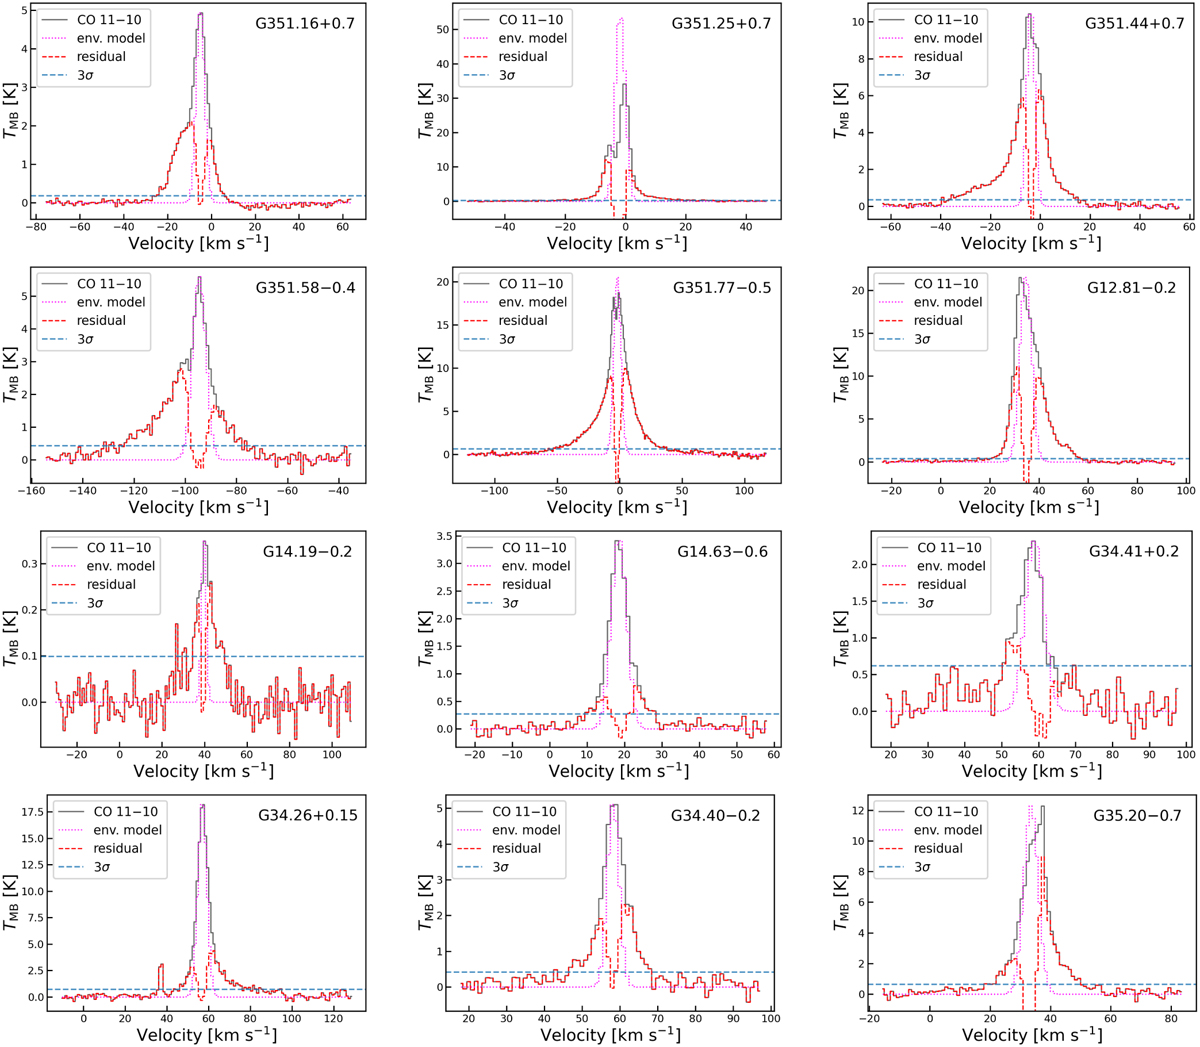
CO 11−10 wing emission (dashed red profile) extracted from the full line (solid black profile). The dotted magenta line is a model of envelope emission. The detection 3σ threshold is shown with a dashed blue line.
Current usage metrics show cumulative count of Article Views (full-text article views including HTML views, PDF and ePub downloads, according to the available data) and Abstracts Views on Vision4Press platform.
Data correspond to usage on the plateform after 2015. The current usage metrics is available 48-96 hours after online publication and is updated daily on week days.
Initial download of the metrics may take a while.