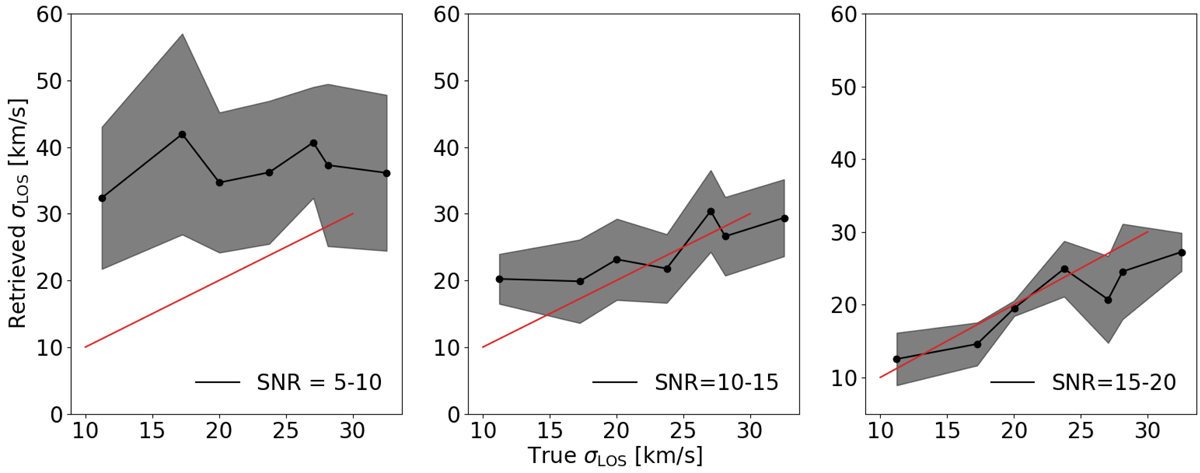
Fig. 7.
Download original image
Results of simulations testing the ability of our pipeline to successfully recover a velocity dispersion of different values at low S/N (per pixel) levels, from S/N = 5–10 (left panel), S/N = 10–15 (middle panel), up to S/N = 15–20 (right panel). Shaded areas correspond to the standard deviation of the measured values at every S/N. The red solid line corresponds to the output values equal to the input ones (unity line). In this experiment, the error is dominated by Poisson noise and no systematic sources of uncertainties have been considered. See Appendix D.1 for details.
Current usage metrics show cumulative count of Article Views (full-text article views including HTML views, PDF and ePub downloads, according to the available data) and Abstracts Views on Vision4Press platform.
Data correspond to usage on the plateform after 2015. The current usage metrics is available 48-96 hours after online publication and is updated daily on week days.
Initial download of the metrics may take a while.