Fig. 5.
Download original image
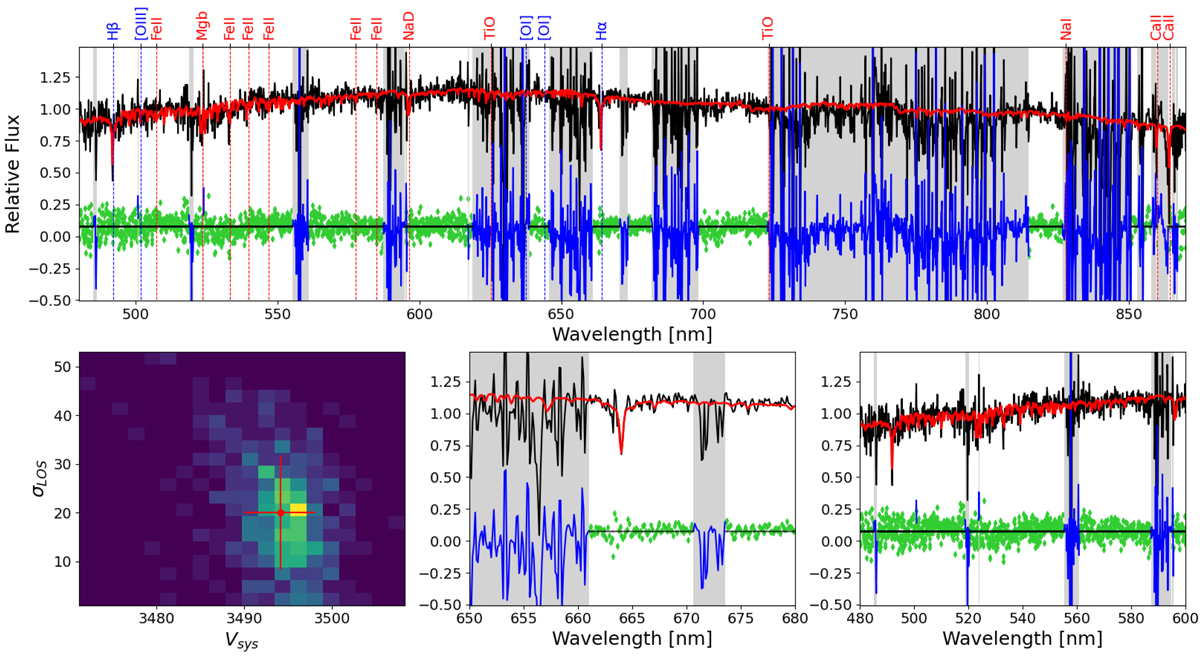
Restframe stacked MUSE spectrum (black solid line) for UDG11 derived inside 1Re. The main absorption features are marked as dashed red (absorption features) and blue lines (absorption features, but potentially also in emission) and labels. The red solid line represents the best fit obtained with pPXF. Green points are the residuals between the observed spectrum and its best fit. The grey areas are the masked regions of the spectra and are excluded from the fit. Bottom (right and middle) panels show the enlarged regions around the main fitted absorption features of the top-row fit in the optical wavelength range 4800 − 7000 Å. The lower-left panel shows the grid of values for the LOS velocity (VLOS) and velocity dipersion (σLOS) derived from the Monte Carlo simulations (see text for details).
Current usage metrics show cumulative count of Article Views (full-text article views including HTML views, PDF and ePub downloads, according to the available data) and Abstracts Views on Vision4Press platform.
Data correspond to usage on the plateform after 2015. The current usage metrics is available 48-96 hours after online publication and is updated daily on week days.
Initial download of the metrics may take a while.