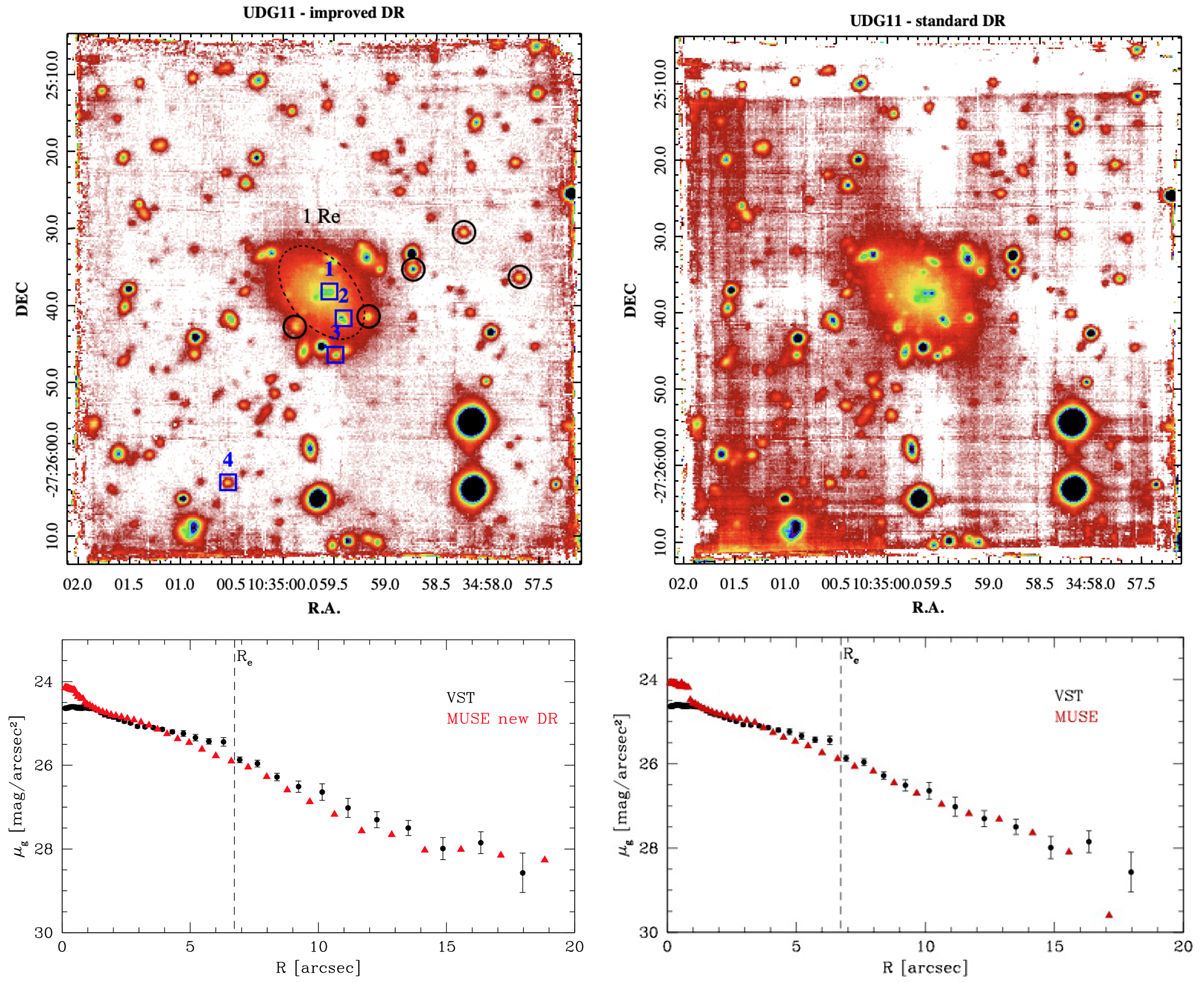
Fig. 3.
Download original image
MUSE reconstructed image of UDG11. Top panels: reconstructed images obtained by improving the sky subtraction (left panel) as described in Sect. 3.2, and with the standard prescriptions for the data reduction (right panel). In the left panels, the dashed ellipse marks the isophote at 1Re. The confirmed GCs are marked with the blue numbered boxes; see also Table 3. GCs 1 and 3 have radial velocities that are consistent with UDG11, while GCs 2 and 4 have radial velocities that are inconsistent with UDG11 but still consistent with the Hydra I cluster. The photometrically preselected GC candidates from Iodice et al. (2020) are marked with black circles. Four of them were found to be emission-line galaxies, and for the other one it was not possible to retrieve the Vsys due to the low S/N (see Sect. 5.5 for details). Bottom panels: azimuthally averaged surface-brightness distribution derived from the MUSE reconstructed image (red triangles) compared with the same profile derived from the VST optical g-band image (black circles) obtained by improving the sky subtraction (left panel) and with the standard prescriptions for the data reduction (right panel). In both panels, the difference between VST and MUSE surface-brightness profiles inside ∼1 arcsec is due to the seeing-limited observations of the optical VST images.
Current usage metrics show cumulative count of Article Views (full-text article views including HTML views, PDF and ePub downloads, according to the available data) and Abstracts Views on Vision4Press platform.
Data correspond to usage on the plateform after 2015. The current usage metrics is available 48-96 hours after online publication and is updated daily on week days.
Initial download of the metrics may take a while.