Fig. 12.
Download original image
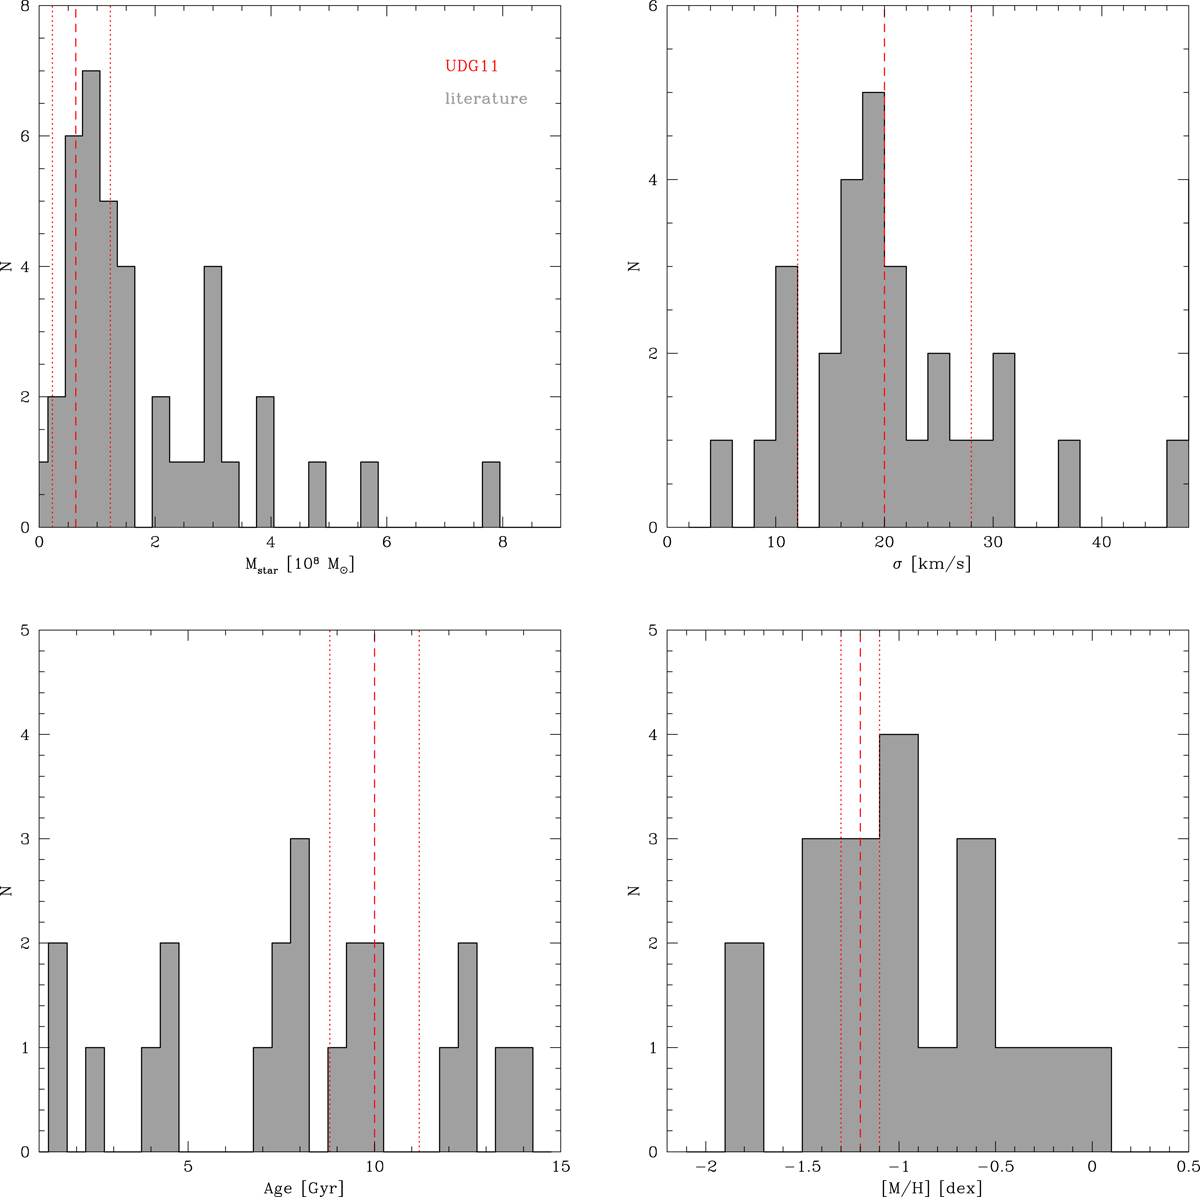
Stellar kinematics and stellar populations for UDGs from the literature compared with UDG11. Histograms (in grey) represent the stellar mass (top-left), velocity dispersion (top-right), age (bottom-left), and metallicity (bottom-right) for UDGs from previous works (Ruiz-Lara et al. 2018; Ferré-Mateu et al. 2018; Chilingarian et al. 2019; van Dokkum et al. 2019; Emsellem et al. 2019; Fensch et al. 2019; Gannon et al. 2021, 2023; Toloba et al. 2018; Martín-Navarro et al. 2019). In all panels, the average value derived for UDG11 and error estimates are marked with the vertical red dashed and dotted lines, respectively. Values are obtained from the fit of the stacked spectrum inside 1Re, and are listed in the first column of Table 2.
Current usage metrics show cumulative count of Article Views (full-text article views including HTML views, PDF and ePub downloads, according to the available data) and Abstracts Views on Vision4Press platform.
Data correspond to usage on the plateform after 2015. The current usage metrics is available 48-96 hours after online publication and is updated daily on week days.
Initial download of the metrics may take a while.